DM FX Outlook: USD uncertainty increases as Trump changes the rules
· Bottom Line: After making initial gains after the election, the USD has followed a similar path to the first Trump presidency, falling back steadily this year as optimism on the economy has faded, with the introduction of tariffs contributing to more negative sentiment. Much as in the first Trump presidency, the USD has underperformed its usual relationship with yield spreads, particularly against the EUR. With the USD having de-anchored from these usual drivers, there is a lot more uncertainty around its future path. The experience of the first Trump presidency suggests the USD could decline further, and we do expect some more weakness, but this will to some extent depend on how the U.S. economy responds to tariff increases and geopolitical developments.
· Forecast changes: We have raised our EUR/USD forecast to 1.20 for end 2025 from 1.15, and cut our USD/JPY forecast slightly to 133 from 135, but we would highlight a high degree of uncertainty this time around.
· Risks to our views: Much will depend on how the US and world economy respond to the US tariff increases. In our central view, we expect to see a modest US economic slowdown, while hopes of an acceleration in European economic growth may fade. But there is a risk that the US suffers a more substantial negative reaction to tariff increases, in which case the US equity market and the USD may fall more rapidly, particularly against the JPY. We have become less optimistic about a ceasefire in Ukraine, and this also suggests some limits to market optimism. Given the high valuations in the US equity market, there is a significant risk of a very sharp autumn sell off in the event that there is evidence of tariffs biting. While most of our central forecasts see fairly gradual moves, large misvaluations in equities and the JPY suggests the possibility of much sharper reactions.
Figure 1: EUR/USD and the 2 year US/Germany yield spread
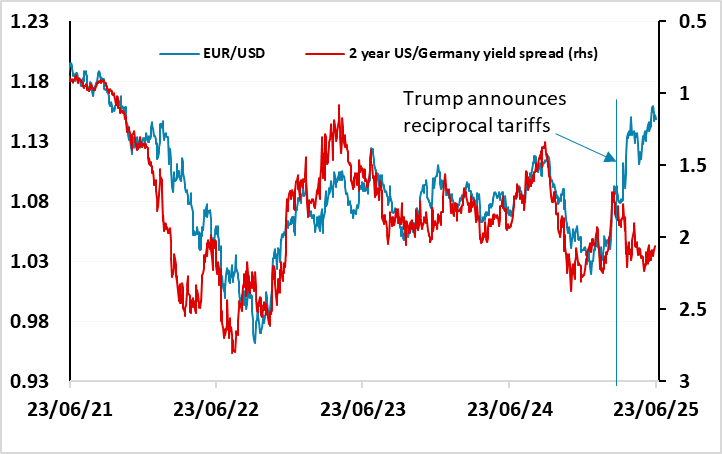
Source: Datastream, CE
EUR/USD broke away from yields spread correlation when Trump announced reciprocal tariffs
As figure 1 shows, EUR/USD had been well behaved in recent years, sticking closely to the 2 year yield spread, until Trump announced reciprocal tariffs at the beginning of April. After that, the USD fell back in general but particularly against the EUR even though yield spreads have moved little since the announcement. The EUR has also been helped by some increase in Eurozone growth expectations due to the promise of increased defence and infrastructure spending, particularly in Germany. But the divergence from the yield spread relationship reflects a general loss of confidence in the theme of US exceptionalism that has supported US equities and the USD in recent years. Fund managers are reportedly reducing their exposure to the US, and if this continues there is scope for the USD to continue to weaken as it did during the first Trump presidency.
Figure 2: The first Trump presidency saw the USD fall in spite of increasingly favourable yield spreads
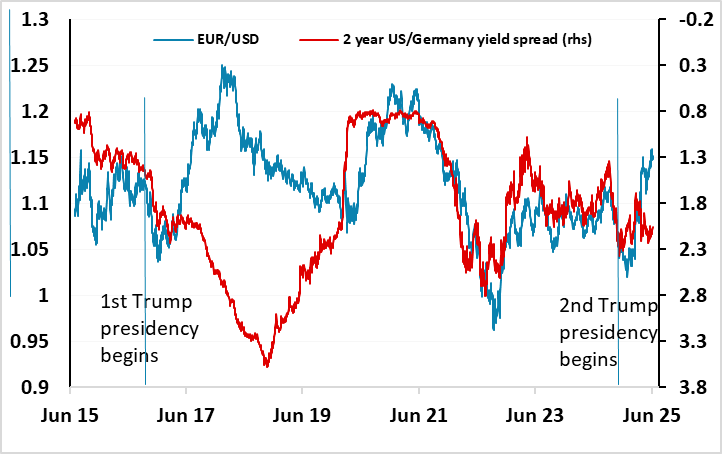
Source: Datastream, CE
For the vast majority of Trump’s first term, EUR/USD actually showed an inverse correlation with yield spreads (see Figure 2), only to revert to normality after the 2020 election. The rationale then was less clear than it is now, at least in the early stages. Tariff increases were much less draconian, and came later in the presidency. Trump did indicate a desire for a weaker USD, and that may have been a factor behind USD weakness, but it’s hard to pinpoint a reason for the USD’s behaviour. It is possible that then, as now, international investors were less enthusiastic about holding US assets under an administration with erratic and unpredictable policies. All this makes it more difficult to predict the likely behaviour of the USD over the coming years. The usual guide of yield spreads driven by growth and inflation realities may have little bearing on the USD’s behaviour, judging by Trump’s first term. For now, we are inclined to follow the trends seen in that first term, given the break we have seen since the tariffs were announced and the similar path seen in the USD so far in this presidency. This suggests there may yet be some more USD weakness to come (see Figure 3). It remains hard to assess how EUR/USD will react to events, although it does now seem that a weaker US economy and weaker US equity market is likely to favour the EUR, with the caveat that relative underperformance from the European economy and increased geopolitical risk could provide the USD with some support.
Figure 3: DXY under Trump
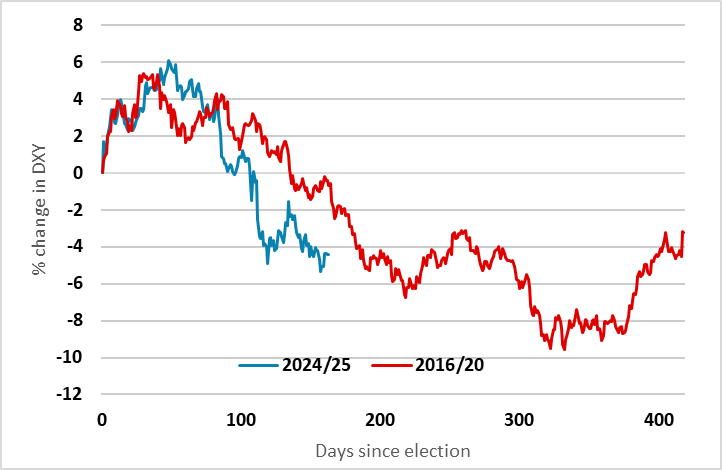
Source: Datastream, CE
JPY still has the most potential for gains
While EUR/USD is hard to analyse due to the break with the normal drivers since the reciprocal tariff announcement, USD/JPY continues to trade somewhat more regularly and broadly in line with the correlations that have held in recent years. The simple nominal yield spread relationship continues to provide some guidance, although any bigger picture analysis of the last few years on this basis suggests USD/JPY should be somewhat lower than current levels (see Figure 4).
Figure 4: USD/JPY and yield spreads
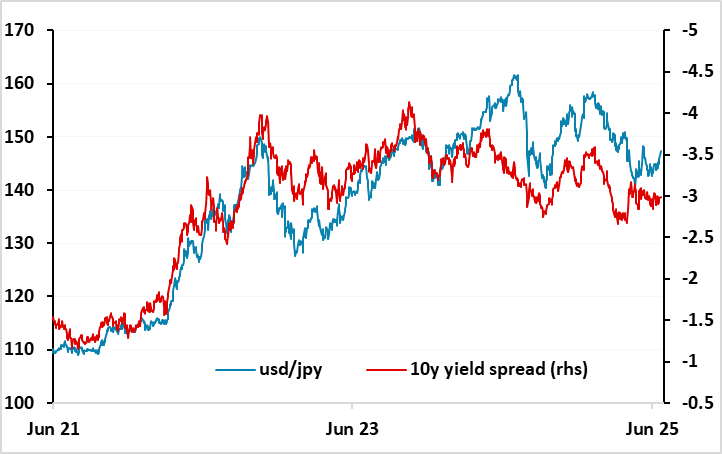
Source: Datastream, CE
USD/JPY also saw some volatility around the tariff announcement at the beginning of April, but has since reverted to a level consistent with the yield spread relationship seen since last August (see Figure 5).
Figure 5: USD/JPY and yield spreads
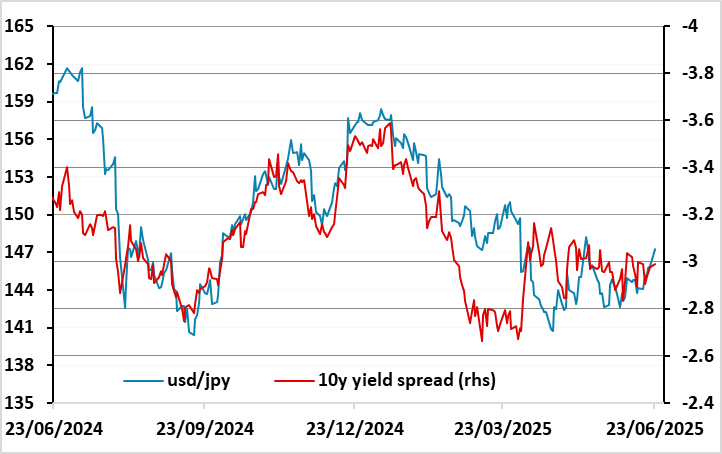
Source: Datastream, CE
But despite this more regular recent relationship, we still feel that the JPY has the most potential to make gains in the medium term. This is due to a combination of its extreme low valuation (see figure 6) and our belief that the current level of U.S. equity risk premia is too low to persist in the current environment of trade and geopolitical uncertainty.
Figure 6: % differences from PPP
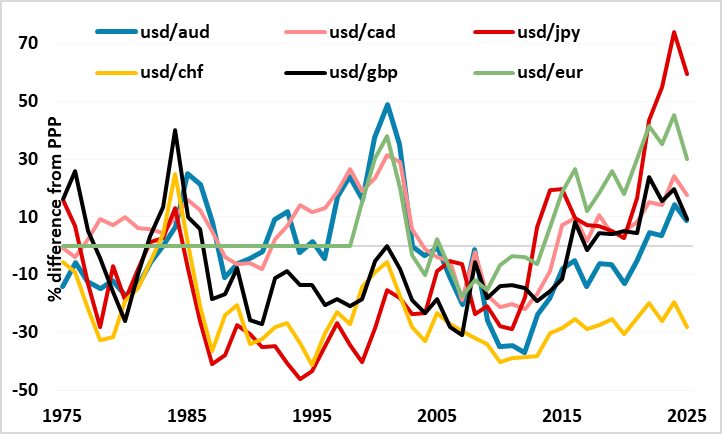
Source: Datastream, CE
However, in the short term, the most likely trigger for any significant JPY movement looks likely to come from shifts in risk sentiment. A sharp weakening in risk appetite would, first of all, tend to benefit the JPY via lower US yields. But there has also been a consistent relationship between JPY crosses and equity risk premia in recent years, which suggests that any rise in risk premia will tend to benefit the JPY, particularly on the crosses against the riskier currencies. We believe US equities are already toppy here because US risk premia are very low given the current state of the economy. There is limited scope for above trend growth given near full employment, and the downside risks due to tariffs and geopolitical concerns, as well as the pressure to hold down the budget deficit, are more substantial than they have been for some time. This makes it difficult to justify equity risk premia at near 20 year lows. Historically, there is a tendency for the market to suffer a dose of reality sometime in the autumn, but the July 9 deadline for the decision on Eurozone tariffs could also possibly be a trigger. Either way, Figure 7 suggests that there is substantial upside risk for the JPY on the crosses if there is any rise in risk premia from here.
Figure 7: GBP/JPY and US equity risk premium
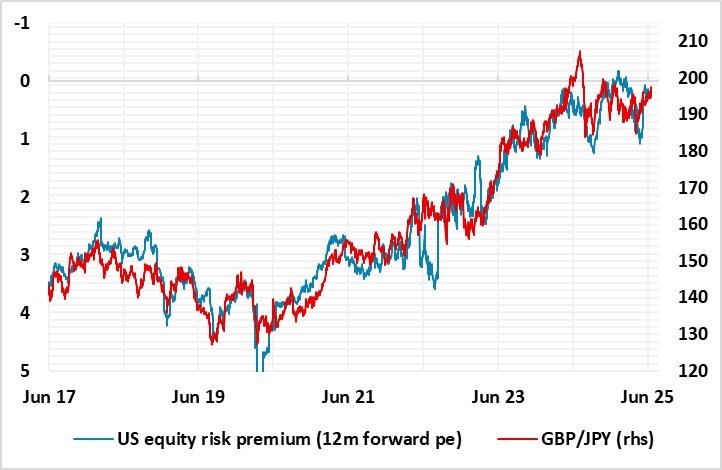
Source: Datastream, CE
EUR/GBP forming a base?
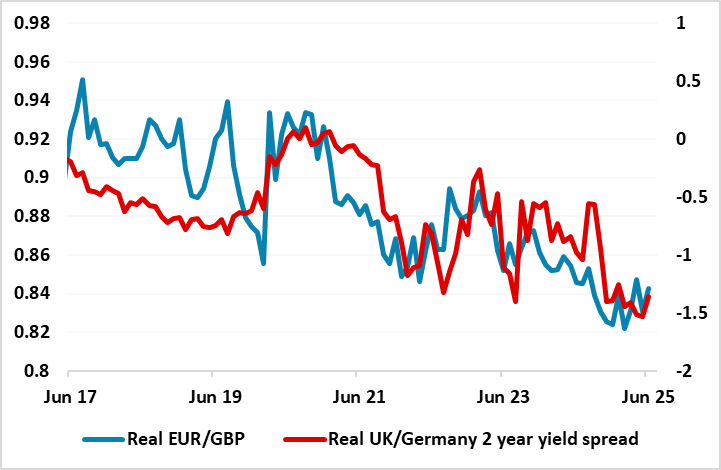
While GBP has generally been firm through this year, EUR/GBP looks to be forming a base near 0.84 and we see scope for further gains through this year and next. The basis for GBP strength in recent years has been the relatively high level of UK real yields, but it seems likely that the real yield spread between the UK and the Eurozone is topping out. From the UK perspective, relatively tight monetary policy has reflected relatively high inflation due to a tight labour market – primarily because of weak labour supply. But the latest set of UK labour market data showed a significant weakening in the labour market, so the concerns of the hawks on the UK MPC about higher wages are likely to fade and allow further rate cuts over the next year. Meanwhile, the ECB are signalling that they may be close to completing their easing cycle, and although we suspect there is a little more to come, this is likely to be due to lower inflation, so that real yields may not fall significantly. There is in any case little clear rationale for UK real yields to be above Eurozone real yields given similar growth prospects, so from here we would expect steady EUR gains v GBP over the next year, with a risk of sharper periods of GBP weakness if we see any sharp weakness in global risk appetite.
Figure 8: EUR/GBP and real 2 year yield spreads
CHF due a turn lower unless we see sharp decline in risk sentiment
The CHF remains one of the world’s strongest currencies, maintaining its extremely high valuation level with only the scandis slightly outperforming it this year. This reflects its continued status as the world’s preferred safe haven, all the more so with the USD losing some of its attraction in the uncertainty of the Trump administration. However, some of its strength is illusory, in that the low level of Swiss inflation has meant that in real terms EUR/CHF and the Swiss trade-weighted index remain in the range seen since 2015, albeit towards the high end.
Figure 9: Swiss real and nominal trade-weighted indices
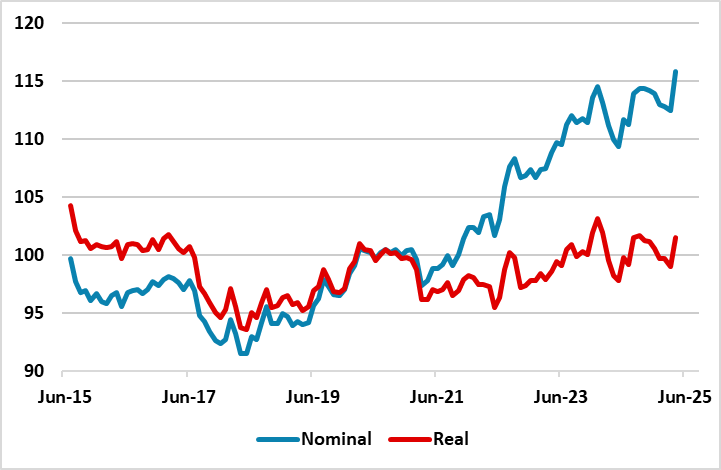
Source: BIS, Continuum Economics
Given the uncertainties facing the world economy this year in terms of both the impact of tariffs and geopolitics, it remains hard to oppose CHF strength. While the SNB have cut their policy rate to zero, the CHF remains quite insensitive to moves in yield spreads, and even though the SNB have also indicated a willingness to intervene to control the value of the CHF, significant CHF weakness only seems likely if we see a big improvement in the geopolitical situation. This might require both an improvement in the Middle East and an end to the war in Ukraine, the latter of which looks increasingly unlikely this year. While EUR/CHF shows little correlation with yield spreads there does tend to be a correlation between real terms moves in EUR/USD and EUR/CHF, so further gains in EUR/USD may see some EUR/CHF advance, while the downside for EUR/CHF may be restricted by SNB action in the event of any flight to safe havens. So we slightly prefer the EUR/CHF upside, and see the JPY as the preferred safe haven, especially since it now has a yield advantage over the CHF.
Figure 10: Real EUR/USD and EUR/CHF
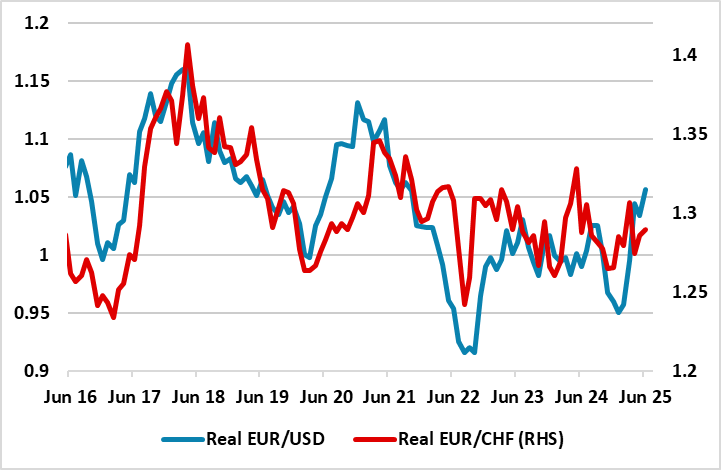
Source: Continuum Economics/Datastream
Scandi outperformance may fade, AUD preferred to CAD
The scandis have been the best performers of the G10 so far this year, with the SEK leading the way as is often the case when EUR/USD rallies. But the SEK looks a little stretched at current levels, especially with the Riksbank moving back into easing mode citing weakening growth momentum due to tariffs and geopolitics. The Norges Bank also cut rates unexpectedly at the June meeting, and has moved into easing mode. While the NOK still looks attractive on a value and yield basis, it remains vulnerable to any risk negative news. The CAD has performed relatively strongly this year given the risks to the economy from US tariffs, while the AUD has underperformed despite having less to fear on the trade front. We continue to favour the NOK over the SEK and the AUD over the CAD in the medium term, but the CAD and SEK will tend to be more resilient in the short term in risk negative scenarios. All these currencies are likely to struggle against the safer havens in the event of any significant decline in risk appetite.
Figure 11: NOK preferred to SEK
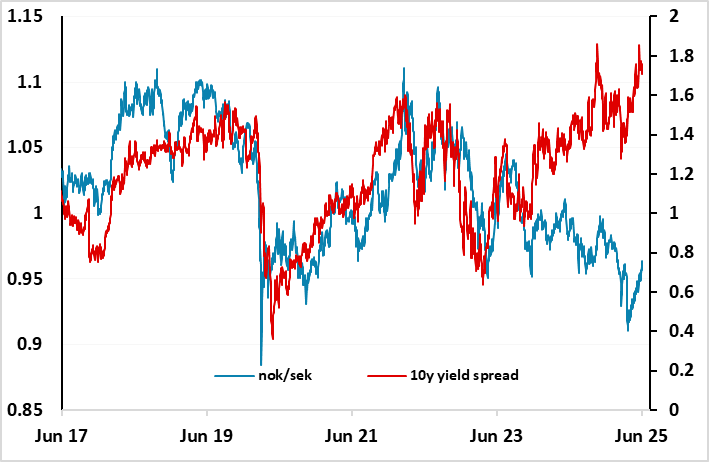
Source: Continuum Economics/Datastream