EZ Real Economy – Diverging Sentiment Indictors Complicate Outlook
The ECB contends that the EZ economy has shown resilience of late. Maybe so, albeit where GDP data (likely to average a satisfactory 0.3% q/q performance so far this year) are probably offering a misleading picture of underlying trends in real activity. Indeed, recent GDP data gains have been predicated on both a surge in Irish GDP as well as what was seems to have been an inter-related EZ export jump in anticipation of the US tariff imposition from April. In fact, whatever message imminent Q2 GDP numbers do provide will offer little guidance to the months and quarters ahead where the U.S tariff reality looms large and threateningly, as the EZ PMIs and European Commission survey data both very much highlight. But those alternative business survey readings are offering diverging signals (Figure 1), the Commission data very much undermined by a weak and possibly understandable manufacturing response that very much conflicts with the recent ECB assertion that ‘surveys point to an overall modest expansion in both the manufacturing and services sectors’. Given what is a very unfavourable trade deal with the U.S. we tend to identify more with the more sobering outlook offered by the Commission data!
Figure 1: Divergent Business Survey Complicate EZ GDP Outlook?
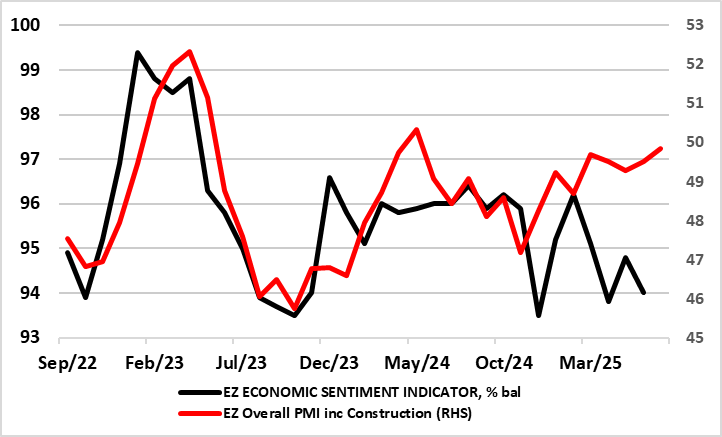
Source: European Commission, Market, CE
Divergence Adds to Policy Uncertainties
There may be many reasons why this divergence between surveys has occurred, partly due to the impact of Irish manufacturing responses within those alternative surveys - very much improved in the PMIs but flat in the Commission numbers. Given what has been protracted global trade and tariff uncertainty, and the sector’s export sensitivity, it could be argued that the weak(er) manufacturing/industrial European Commission survey data make more sense than the vastly improved factory sector PMI readings seen of late. But there may be shortcomings in the Commission data for Ireland where much recent responses have had to be interpolated rather than formally survey.
Irish Tail Still Wagging the EZ Dog?
But there are questions marks over the accuracy and authenticity of the PMI numbers too. This is partly in comparison to the much wider spread of country and sector detail offered by the Commission numbers - the latter provide insights in retail and the consumer alongside the manufacturing, services and construction insights in the PMI – NB in Figure 1 we have augmented the PMI composite with the construction PMI to make it more directly comparable to the Commission economic sentiment index which encompasses all five sectors. Notably, albeit with some delays, the Commission data encompasses updates from all 20 EZ economies while the PMI offers only eight (for manufacturing) and five for services – both including Ireland. But with the PMI compliers (Markit) unwilling to specify what actual weights are given to either of the sectors and countries, it is unclear whether Irish PMI responses (a six-point jump in the last year) are not being overstated in terms of the impact and boost to the whole EZ. Moreover, given Ireland’s exposure to trade and manufacturing (particularly what is very uncertain pharmaceutical picture which supports 20% of Irish GDP and 60% of its exports), that six-point PMI jump seems hard to understand, especially as it now conflicts with early estimates that indicate GDP decreased by an estimated 1% q/q in Q2, a result mainly driven by a fall in the multinational dominated Industry sector.
Figure 2: Divergent Manufacturing the Main Issue?
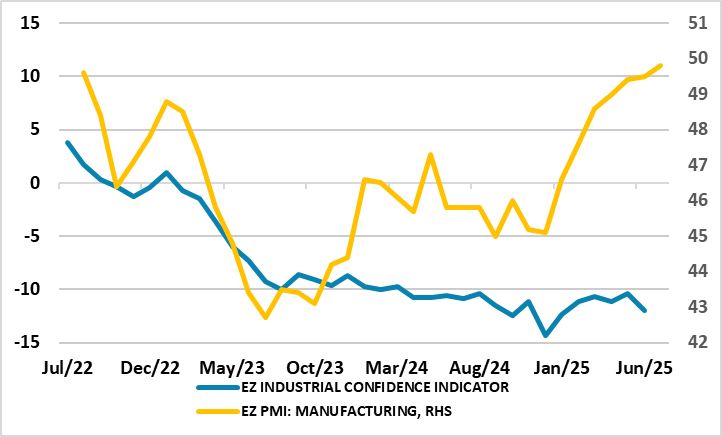
Source: European Commission, Market, CE
This is hardly a surprise as it comes after a 7.4% q/q Q1 Irish GDP surge that was always going to reverse - this partly explaining the widespread expectation for a Q2 EZ flat-to-modest contraction as firms frontloaded exports ahead of expected tariff hikes and where further such outcomes may be seen in this and the coming quarter. But there are other discrepancies between the PMI and Commission manufacturing outcomes for the likes of Germany, Greece and Spain.
Figure 3: Hitherto Solid Services Losing Momentum?
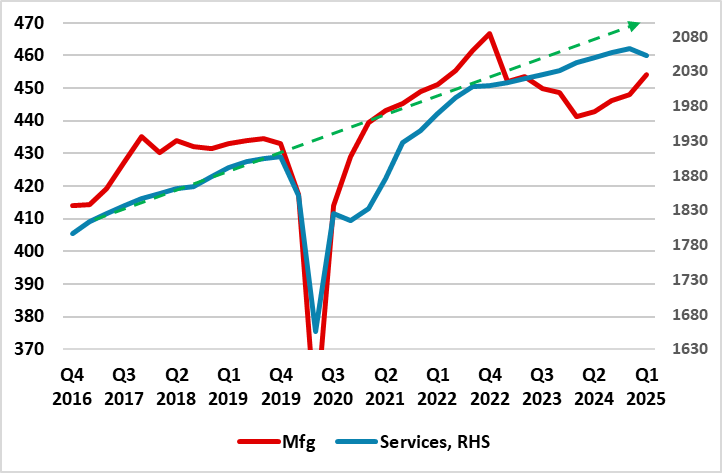
Source: Eurostat (EUR billion), green line is previous trend
Otherwise, the PMI data also offers a relatively less downbeat picture for EZ construction. But one thing both sets of survey data agree on is a slowing in the services sector of the EZ, something that official monthly production data also point to. Given how important service shave been in supporting EZ GDP in the last few years (Figure 3), this is a worrying development and may reflect two of the downside risks we feel the ECB is under-estimate – a slowing jobs market and a still tight financial conditions backdrop. All of which explains our sub-consensus and below ECB growth outlook into 2026 and where our 0.9% projection may be prone to a downgrade once we have clearer detail of the EU trade deal.