DM FX Outlook: USD steadies but vulnerable to equity correction
· Bottom Line: The USD has continued to edge lower against the EUR in the last quarter as market expectations of Fed easing have increased following clear weakening in U.S. employment growth. But at this stage the data doesn’t indicate we are heading for recession, and this suggests we may maintain broad stability near term in major FX markets. Nevertheless, there are still substantial misvaluations in the G10 currencies, notably the weakness of the JPY and the strength of the CHF. These look to be mainly related to the strength of risk appetite and the continuing gains in the U.S. equity market, but suggest potential for sharp volatility on an equity correction.
· Forecast changes: Our changes have been marginal. We have slightly increased out USD/JPY forecasts due to the persistence of JPY weakness, and slightly reduced our CAD, NOK and NZD forecasts, but changes have been modest.
· Risks to our views: Our central view assumes a significant equity market correction in Q4, which will trigger a JPY recovery towards the levels suggested by yield spreads. The trigger for this is unclear. It could come from a weak U.S. employment report showing negative employment growth, or from a disappointing earnings season, or from evidence of sticky inflation that undermines market expectations of Fed easing and consequently of US growth. But valuations look unrealistic in a slow growth world, and with very little scope to price in further Fed easing unless we see recession fears emerge, downside risks dominate. However, it is possible that the equity market continues to hold current levels or edges higher as data and earnings match expectations. If so, the FX market may remain relatively calm with the JPY still weak.
Figure 1: EUR/USD and the 2 year US/Germany yield spread
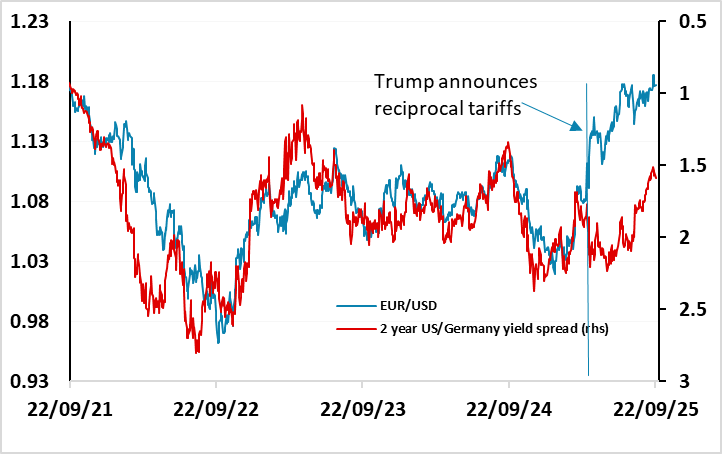
Source: Datastream, CE
EUR/USD broke away from yields spread correlation when Trump announced reciprocal tariffs
As figure 1 shows, EUR/USD had been well behaved in recent years, sticking closely to the 2 year yield spread, until Trump announced reciprocal tariffs at the beginning of April. After that, the USD fell back against the EUR and related currencies, but not against the Asian currencies, with the JPY and AUD underperforming relative to yield spreads. Reports suggest this reflected a shift by institutional investors away from the US towards Europe, although it may also reflect increase FX hedging. It remains unclear why this excluded most Asian currencies. Subsequently, we have seen a weakening in U.S. employment growth that has led to a decline in U.S. yields and a further rise in EUR/USD, although once again, the JPY has not participated. Some of the risk premium in the USD that emerged after the tariff announcement has been eroded as trade deals have been made and the largest tariffs have been reduced, and the EUR/USD outperformance relative to yield spreads has declined through Q3. There has been some restoration of the relationship between yield spreads and EUR/USD. We would expect this to continue through Q4, but the EUR may not benefit much from the correction in risk assets that we anticipate.
Figure 2: Correlation of One Week Changes in FX With One Week Changes in S&P— 3 month rolling
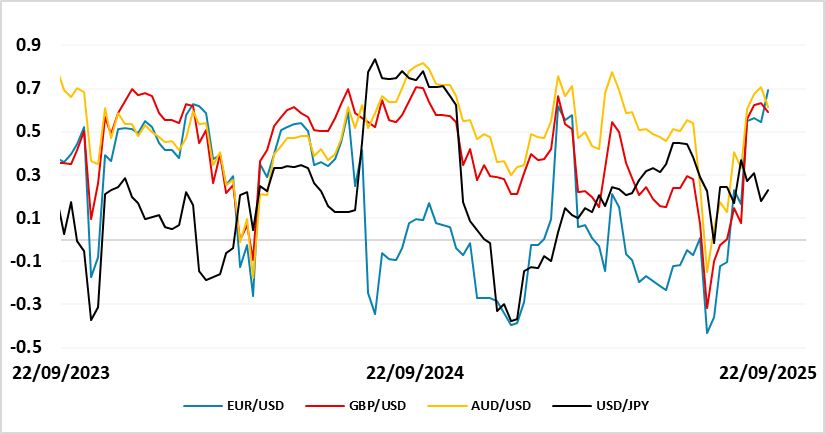
Source: Datastream, CE
EUR/USD upside may be restricted if equities weaken
While this is likely to move yield spreads in the EUR’S favour, EUR/USD has also generally enjoyed a positive correlation with equities, so any significant equity downturn might see some initial decline in the EUR and other “riskier” currencies. Of course, when equities fell back from February to April, the correlation with equities reversed and the USD fell back, but this might be seen as a one off “structural” change as investors reduced U.S. weightings, and may not be repeated in another correction. Even so, we still see some modest EUR/USD strength in the event of an equity market correction. The Eurozone economy will not be impervious to weaker asset markets and/or a slowdown in the U.S., but it is less sensitive to market moves and is likely to see no more than a mild impact. This could still be significant given the low starting point for Eurozone growth, and we still see more downside for Eurozone yields than the market, so we are not looking for substantial EUR strength.
Figure 3: USD/JPY and 10 year US/Japan yield spread
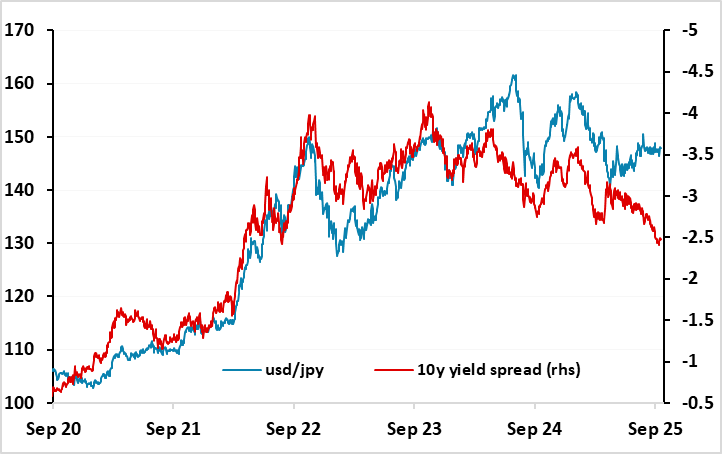
Source: Datastream, CE
More potential for JPY gains
USD/JPY has dramatically underperformed its historic relationship with yield spreads in the last few months (Figure 3), remaining nearly unchanged in the face of a sharp contraction in spreads. Unlike the EUR, the JPY didn’t benefit from Trump’s announcement of reciprocal tariffs, and while the EUR has outperformed its normal relationship with yield spreads in the last two quarters, the JPY has underperformed. While there might have been some initial concern that Japan would suffer more from tariffs than others, the trade deals between the U.S. and the EU and the U.S. and Japan don’t put Japan at any significant disadvantage. So the reason for JPY weakness appears to be the strength of risk appetite and the continuing decline in risk premia. The JPY has shown a strong positive correlation with U.S. equity risk premia over recent years, particularly on the crosses. While there is little fundamental justification for this, it is a relationship that persists and currently appears to be driving JPY crosses more reliably than any yield spread relationship (see Figure 4).
Figure 4: GBP/JPY and U.S. nominal equity risk premium
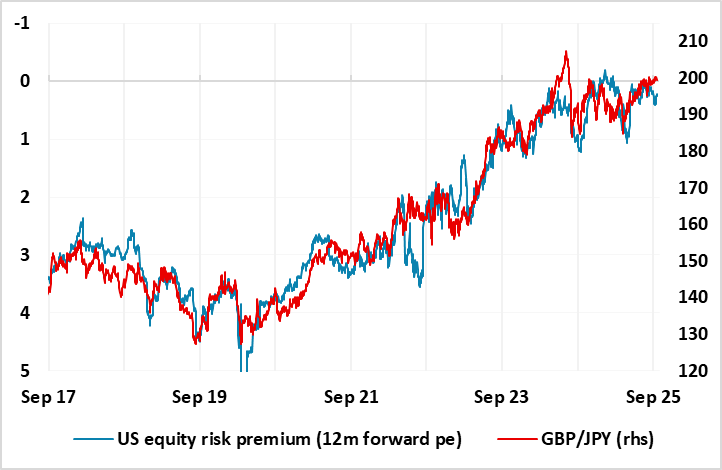
Source: Datastream, CE
Our central view involves a 7% correction lower in U.S. equities by the end of the year, and some consequent decline in U.S. yields as the market anticipates more Fed easing in response. This would imply a substantial rise in equity risk premia, consistent with a EUR/JPY decline to the 160-165 area and a GBP/JPY decline to the 185-190 region, based on the relationship show in Figure 4. This would be consistent with a USD/JPY drop to 135, which would move it closer to if not quite back in line with the historic yield spread relationship. Bigger picture, we would still argue for further JPY gains longer term, as valuations remain extreme (see Figure 5), with a move to 125 seen by the end of 2026, even though we expect an equity market recovery back to current levels by then.
Figure 5: % differences from PPP
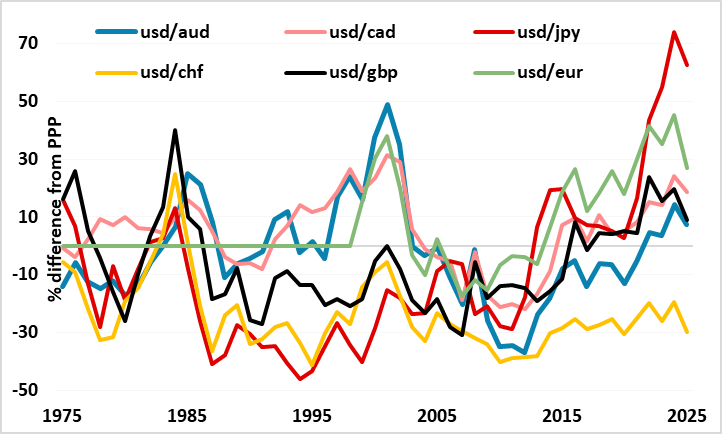
Source: Datastream, CE
GBP risks on the downside
The main event for GBP in Q4 will be the November 26th Budget, which will have significance for at least the next year. GBP has periodically suffered through this year, and in previous years, from concerns about the rising government debt burden and the need to reduce the fiscal deficit. Due to the government’s failure to pass their proposed welfare spending cuts through parliament, the Budget is expected to see a significant fiscal tightening of £20bn or more. This is not currently included in the BoE’s projections for the economy, and so can potentially have a significant impact on monetary policy. The exact size and timing of any tightening will be important for the near term monetary policy outlook and GBP. Typically, it makes sense for the government to institute any tax increases early in the political cycle, to minimize the electoral impact, and if this is the case the fiscal tightening is likely to mean increased monetary easing from the BoE through 2026. In any case, we expect the BoE to ease significantly more than the 45bps priced in by the end of 2026, as there is already evidence of significant weakness in the UK labour market which can be expected to feed through to wages and inflation in the coming year.
EUR/GBP has continued to move broadly in line with real yield spreads in recent years, and we would expect real UK front end yields to converge with EZ yields in the coming year or two. While convergence may be slow, it should lead to EUR/GBP edging up towards 0.90. There are also risks that we have more periods of GBP weakness if the government fail to address fiscal concerns, so whether there is fiscal tightening or not, GBP risks look to be on the downside.
Figure 6: Real EUR/GBP and real yields
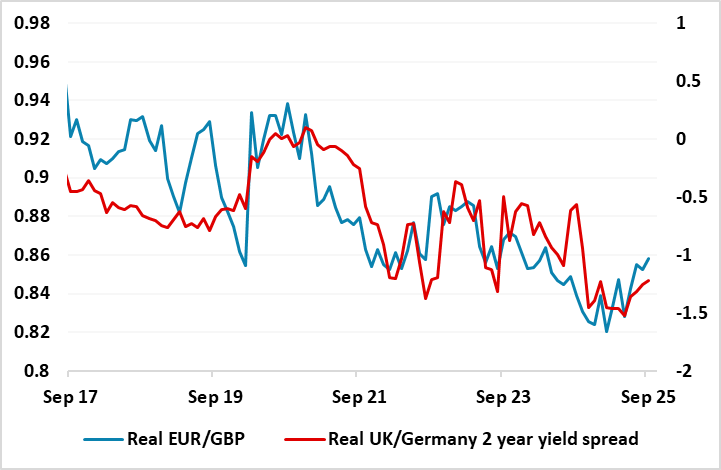
Source: Datastream, CE
CHF strength remains extreme
The CHF remains something of an anomaly in that it is traditionally a safe haven, but has been the world’s second strongest currency this year (after the SEK) in a generally risk positive market, despite the SNB cutting the policy rate to zero. It also remains by far the most expensive major currency on a PPP basis (see figure 5). Given the failure of the CHF to decline in risk positive conditions this year, it’s hard to imagine a scenario where it can see a significant move lower. In truth, it is less strong in real terms this year than it has been in nominal terms, due to the low level of Swiss inflation. But in the absence of a major shock, EUR/CHF looks to be forming a base near 0.93, and we would expect the SNB to oppose a move below there, at least verbally, and possibly by intervention or even by instituting negative rates, although this would be a last resort. We therefore see a mild rise in EUR/CHF to put it back in the middle of its post 2015 range in real terms.
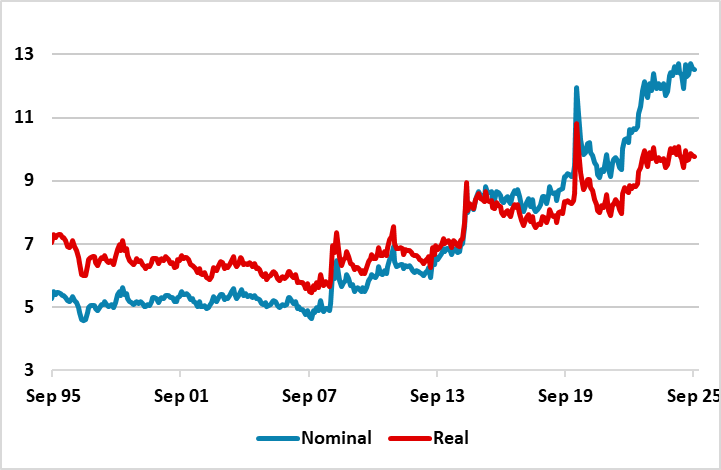
Figure 7: EUR/CHF real and nominal
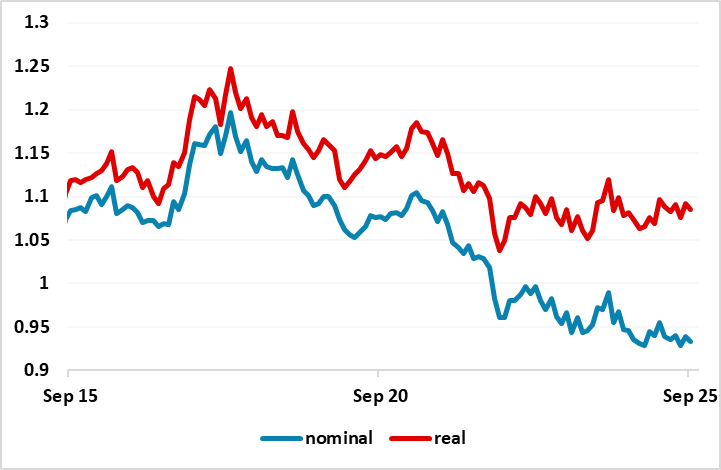
Source: Datastream, CE
However, in the short term, the most likely trigger for any significant JPY movement looks likely to come from shifts in risk sentiment. A sharp weakening in risk appetite would, first of all, tend to benefit the JPY via lower US yields. But there has also been a consistent relationship between JPY crosses and equity risk premia in recent years, which suggests that any rise in risk premia will tend to benefit the JPY, particularly on the crosses against the riskier currencies. We believe US equities are already toppy here because US risk premia are very low given the current state of the economy. There is limited scope for above trend growth given near full employment, and the downside risks due to tariffs and geopolitical concerns, as well as the pressure to hold down the budget deficit, are more substantial than they have been for some time. This makes it difficult to justify equity risk premia at near 20 year lows. Historically, there is a tendency for the market to suffer a dose of reality sometime in the autumn, but the July 9 deadline for the decision on Eurozone tariffs could also possibly be a trigger. Either way, Figure 7 suggests that there is substantial upside risk for the JPY on the crosses if there is any rise in risk premia from here.
AUD and NOK still have potential to make gains
While it is a little surprising that the CHF has outperformed in a risk positive market, it is similarly unusual for the AUD and NOK to underperform in these circumstances, but both have lagged substantially behind the levels suggested by yields spreads over the last year. In the AUD’s case, some of its underperformance has related to concerns about China, but as these have faded AUD/USD has started to edge higher. Even so, it looks to have potential to extend gains as long as Asian equity sentiment remains positive.
Figure 8: AUD/USD and yield spreads
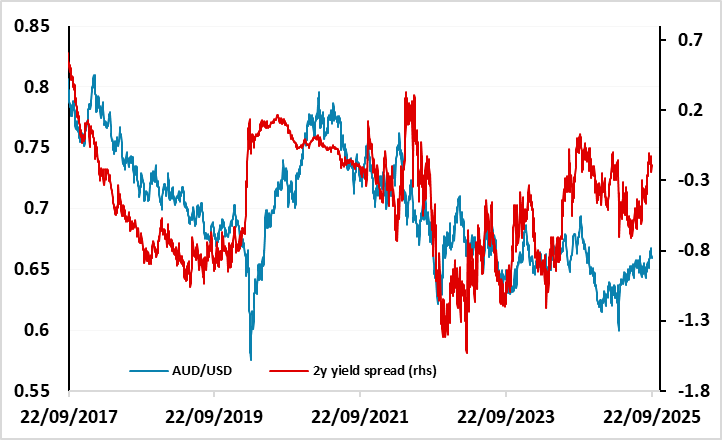
Source: Datastream, CE
The NOK’s weakness has no obvious cause, but may relate in part to its historic high valuation and in part to the large foreign currency investments from the government pension funds. But neither of these are new and don’t really explain its weakness in the last year or two. While we still see scope for a NOK recovery over time, it has become hard to find a trigger for it given the persistent weakness in the last year, but attractive yields relative to most of Europe should still make it a strong long term performer. But risk sensitivity and low liquidity make the NOK vulnerable in the event of any shocks.
Figure 9: CHF/NOK real and nominal
Source: Datastream, CE