Eurozone Flash GDP Preview (Oct 30): Resilience in the Dock?
As we highlighted repeatedly of late, for an economy that has seen repeated upside surprises and apparently above trend growth, now some 1.4% in the year to Q2, GDP data do not seem to have had much impact is shaping, let alone dominating, ECB policy thinking. But we think this may shift as the ECB begins to question its recent mantra that the economy has been resilient, not least by accepting that EZ underlying growth has been nowhere need that of the recorded headlines. It is possible that the Q3 GDP data may help trigger this as we anticipate a modest downside surprise of zero q/q (Figure 1), this however also tallying with the ECB projection. More likely, ECB thinking may be slower to shift as shorn of details, this flash data would be down but only from what was an upwardly distorted Q1 result and a softer Q2 picture and would still come with continued marked divergences within the main EZ economies. Instead, and for the time being, the ECB seems to be in a much more risk management frame of mind and where policy freedom has been granted by clear disinflation. Those risks are obviously (but not solely) centred around the tariff outlook but also reflect a fuller and more sobering assessment the overall EZ monetary stance.
Figure 1: Weaker But Still Divergent EZ GDP Picture?
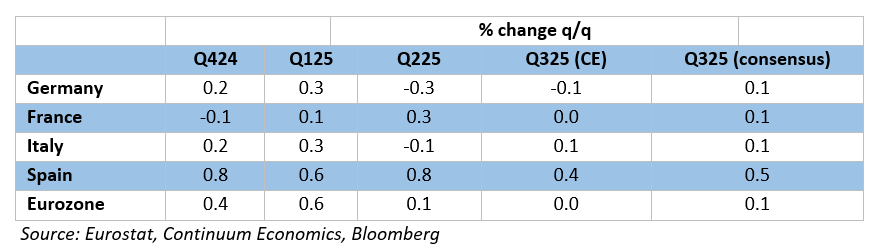
Continuing a series of upside surprises, EZ GDP overshot consensus in Q2, albeit coming in notch below ECB expectations. The data is still very much a correction back from the Q1 surge data (Figure 1), but our flat Q3 projection chimes with downside risks hinted at by recent m/m swings in services, manufacturing and construction production that also tally with softer survey messages but still show geographical divergences.
Notably, that above-trend growth in the last year came alongside what has been significant disinflation, this very much supporting our long-held view that weaker price pressures of late have been mainly supply driven and thus where weaker demand ahead could prolong, if not accentuate, such disinflation.
Irish Tail Wagging the EZ Dog?
The ECB contends that the EZ economy has shown resilience of late. But the ECB will be as aware as everyone the extent to which recent GDP numbers may be giving a misleading picture, actually offering little insight into underlying activity. Indeed, recent GDP data gains have been predicated on both a surge in Irish GDP as well as what was seems to have been an inter-related EZ export jump in anticipation of the US tariff imposition from April. In fact, EZ GDP growth has been very dependent upon Ireland for the last year, the latter accounting for half the y/y growth seen into Q2 and where the ex-Ireland q/q rate has averaged less than 0.2% in the last two years (Figure 2). This makes our 2026 GDP projection of 0.8% easier to understand as it merely extrapolates from recent trends. Moreover, to us this soft outlook suggests that the profile for GDP will have made little inroad in the EZ output gap. Regardless, the data do suggest a marked pick-up in productivity growth has occurred of late, which may be somewhat more persistent given the labor hoarding the EZ economy has seen in the last few years.
Figure 2: EZ Growth Inc and Ex Ireland
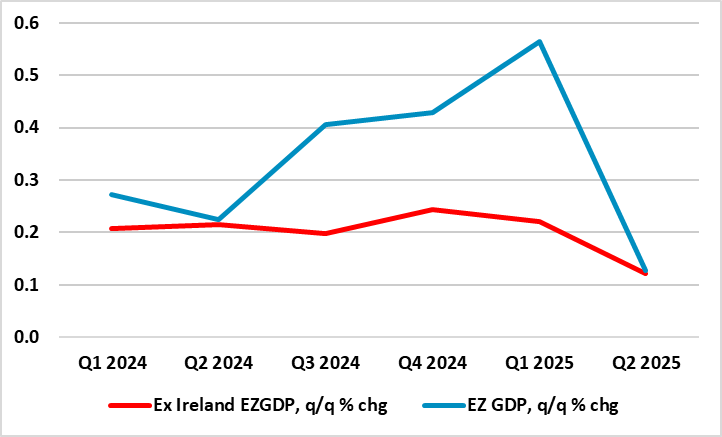
Source: Eurostat
Indeed, with EZ y/y growth up to 1.5% in Q1, and employment rising half that, productivity (in term of output per employee) rose to 0.8%, twice what the ECB has pencilled in for the while for 2025 and more in tune with its 2026-27 projections. Moreover, productivity in term of output per hour was even more impressive as hours worked have hardly risen in the last year, this possibly a result of the labor hoarding alluded to above. If the latter is so, it does suggest perhaps a more sustained productivity rise as any further rise in activity is unlikely to be based around significant employment advances.
GDP Flash Shortcomings
Amid a paucity of reliable data, it is important to recognize that there are clear shortcomings to the flash estimate for EZ GDP. No details come with these flashes and they are prone to clear revisions, where even a 0.1 ppt change can be very meaningful when the economy is hardly growing. They are based on incomplete activity numbers with usually only one monthly published value for services and two for construction and manufacturing. However, aggregating these three output sectors allows the creation of a monthly GDP proxy, albeit a figure that is volatile far from tallies with actual GDP outcomes. Ever so, this supports our flat Q3 projection, pointing to a loss of momentum spilling over into the current quarter – as the surveys suggest with those provided by the European Commission softer than the PMIs figures – this notable given the wider sector and geographical coverage.
I,Andrew Wroblewski, the Senior Economist Western Europe declare that the views expressed herein are mine and are clear, fair and not misleading at the time of publication. They have not been influenced by any relationship, either a personal relationship of mine or a relationship of the firm, to any entity described or referred to herein nor to any client of Continuum Economics nor has any inducement been received in relation to those views. I further declare that in the preparation and publication of this report I have at all times followed all relevant Continuum Economics compliance protocols including those reasonably seeking to prevent the receipt or misuse of material non-public information.