Eurozone Labor Market: A Structural and Disinflationary Shift?
That we think the ECB is being optimistic about the real economy and labor market outlook is almost an understatement made all the more so since the outbreak of the Iran War. In the ECB’s latest baseline scenario, recession is clearly avoided and the jobless rate, while revised a little higher (Figure 1), does not rise at all. In contrast, we think a rise is on the way. Regardless, the point we have made repeatedly is that the current near record-low jobless rate is not a good indicator of current EZ labor market tightness, it contrasting with the messages from survey and vacancy data (Figure 3). This seems to be something the ECB is now accepting, noting how currently lower labour demand indicates less competition among firms for additional workers. We concur with its analysis that this makes the labor market far less wage inflationary than when the Ukraine War started (Figure 4). But we would extend that ECB analysis to suggest that the labor market is now even more efficient than that in the decade before the pandemic (Figure 5) when wage inflation was then low enough to have helped the ECB inflation target being undershot – repeatedly!
Figure 1: ECB Sees No Real Hit to the Labor Market?
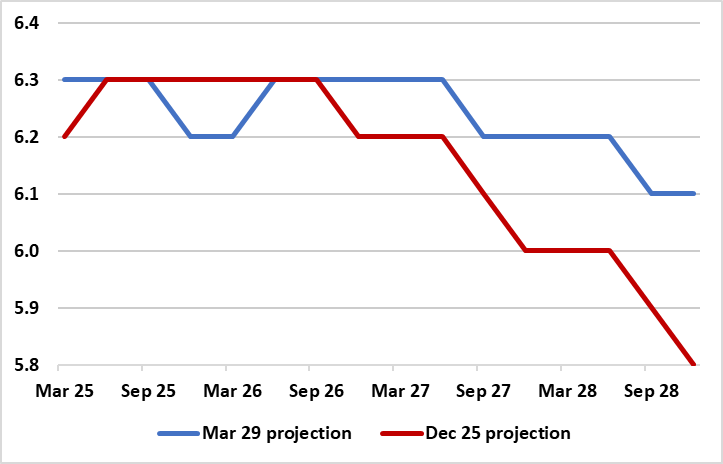
Source: ECB Macro Projections - %
Assessing Labor Market Slack
As most would consider, slack in the labour market is a major input into monetary policy assessments given its impact on wage growth and thus overall inflation. While the unemployment rate has traditionally served as the favoured indicator of such slack in policy discussions it has severe shortcomings as it can picture just one side of the balance between effective labour supply and demand. This is illustrated in the ECB’s latest forecast, based around a baseline which used mid-March market thinking pointing to quarterly average (Brent) oil and gas prices peaking peak at around USD 90 per barrel and €50 per MWh respectively this quarter and will then declining over the following quarters (not too far away from our own baseline based in a 4-8 week war).
Notably, this still sees the current near-record low jobless rate edging down over the forecast horizon, albeit less so that envisaged three months ago (Figure 1). Regardless, this still low jobless rate results in less pronounced but still slowing wage growth according to the ECB projections, this being something that seemingly conflicts the classic Phillips curve relationship which would suggest that a lower unemployment rate pushes up wage pressures. But the reason why this occurs is that unemployment does not capture the supply-demand balance well, in particular when either/both labour supply and demand move markedly. Of late, it is the latter that has been moving clearly.
Figure 2: EZ Workforce Growing and Boosting Labor Supply
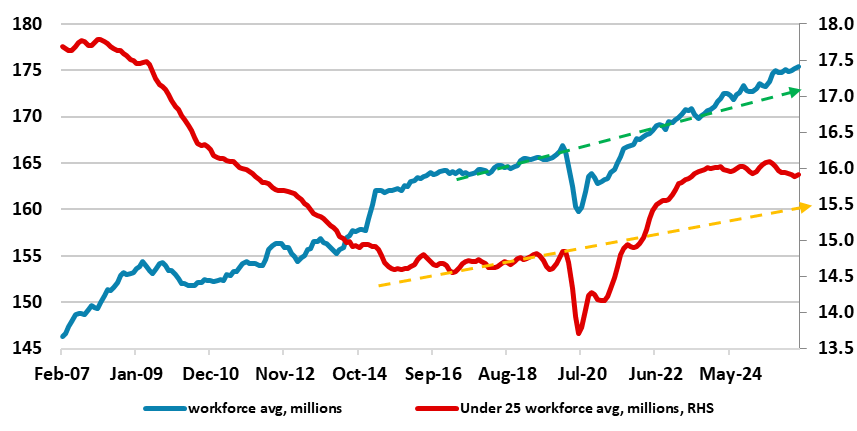
Source: Eurostat, CE - dashed lines are pre-pandemic trends
Growing Labour Force Reflects Several Sources
As we have maintained for some time, the low(er) EZ jobless rate is mainly a result of an increasing labor force (Figure 2) leaving only a relatively minor role of changes in unemployment to meet firms’ labour demand in the last 3-4 years. Employment growth stems from either/both changes in unemployment and/or previously inactive workers that join the labour force. In the EZ, it was the case that following the recovery from the great financial crisis and the sovereign debt crisis, the pool of unemployed remained the key source of fresh jobs. But after the pandemic, the pool of unemployed contributed only about 500,000 to the additional 6 million jobs created in this period. Of that increase in the workforce or labor supply, more than 3 million additional jobs were filled by people immigrating into the EZ while some 2.5 million more jobs were taken by previously inactive nationals, over half of which were women.
Figure 3: Record-Low Jobless Rate Despite Falling Labor Demand
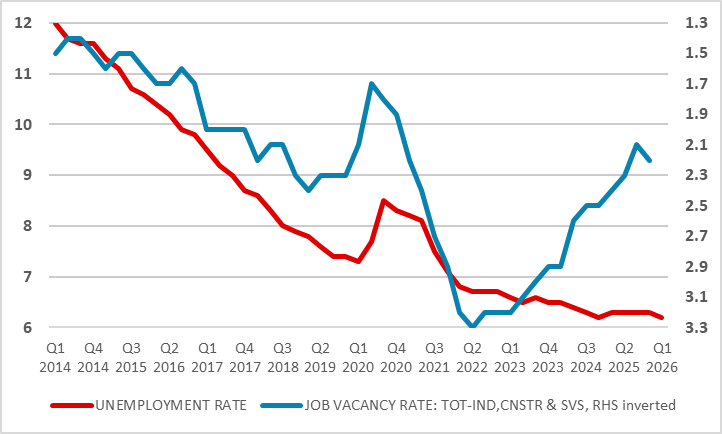
Source: Eurostat, CE (%)
Notably in these 3-4 years, and as Figure 2 also shows, the participation of older workers has increased noticeably over time, partly due to growing and improved life expectancy, but probably also an attempt by households to bolster real incomes lost to the surge in inflation. Indeed, since late 2022, the participation rate of 55-74-year-olds has increased by nearly 1.7 percentage points. Moreover, there is still a pool of untapped potential labor supply. Nearly 7 million people in the EZ are generally willing to work, but they are currently either not available to work immediately or not actively searching while around 5 million workers are so-called underemployed, working far less hours that they wish.
Other Measures of Slack
The ECB analysis also highlights that employed workers switching jobs is also an essential indicator of slack and wage pressures. When firms find it more difficult to recruit additional workers due to low unemployment, they try to poach workers from other firms, offering better employment conditions, including higher pay, to incentivise workers to switch jobs. Recent data, suggest far less so-called job-to-job transitions in the last few years, thereby indicating a less tight labour market.
Figure 4: An Alternative View of the Shifting Labor Market
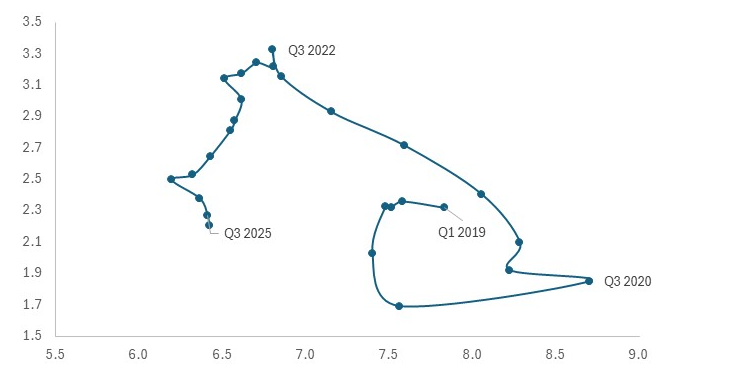
Source: ECB (x-axis: unemployment rate (% of labour force); y-axis: job vacancy rate (% of filled and unfilled jobs)
But in assessing slack, labour demand is also important, this best highlighted by job vacancies and we repeat a chart used much by us in recent years which shows the vacancy rate relative to the jobless rate plotted over time. The vacancy rate has been falling for the last 2-3 years, thereby deviating from the on-going drop in the jobless rate and further highlighting how the current labor market situation is very different to that of four years ago – ie much more slack. But this crucial relationship between the jobless and vacancy rate can also be plotted as a scatter diagram with each point representing the combination of the two series at different points in time. This is known as a “Beveridge curve”.
As opposed to severe downturns when firms cut staff more drastically, in a more modest slowdown, firms might simply hire less or just not replace retiring staff, without necessarily laying people off. A Beveridge Curve is shown in Figure 4 and echoes Figure 3 in showing that this has been happening since mid-2022 so that currently there are relatively fewer openings per unemployed. This should, all else equal, translate into lower wage pressures than what the historically low current level of unemployment might suggest.
Structural Shift Underway?
Rather than just points, trend lines can be estimated to arrive at a more fully fledged Beveridge curve which offers a clearer picture whether a more structural than cyclical shift in the labor market has taken place. In this regard, it is the case that changes in the business cycle cause movements along the curve, with booms moving it up/left and recessions moving it down/right. But the whole curve can shift too so that an outward shift (up and to the right) indicates a less efficient labor market, where more vacancies exist for any given level of unemployment (eg skill mismatches), while an inward shift suggest the very opposite.
Figure 5: A Structural Shift in the Labor Market
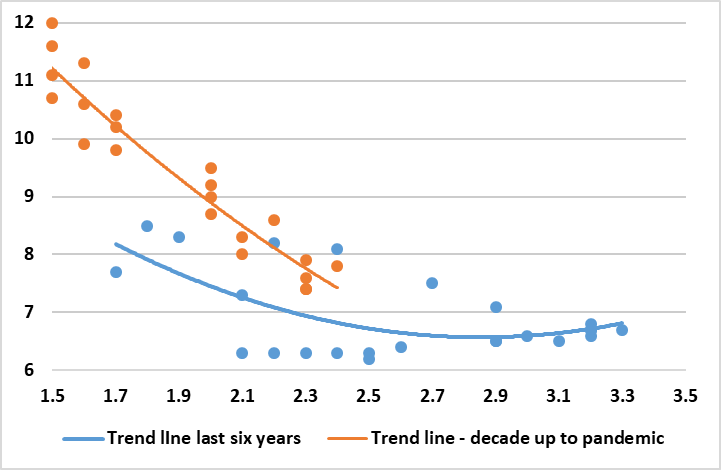
Source: Eurostat, CE (y-axis: unemployment rate (% of labour force); x-axis: job vacancy rate (% of filled and unfilled jobs))
And the latter seems to have occurred in the last few years. As Figure 5 shows, the Beveridge curve of the last six years has shifted down compared to the curve of the decade before. This is important as it implies that the EZ labor market may be less wage inflation prone not only compared to four years ago and the outbreak of the Ukraine War but even compared to the low inflation decade before the pandemic. This is the main reason we see the current energy spike having few lasting consequences in terms of second round or spill over effects. This is even without the rise in unemployment which we think is on the way. This may reflect a fresh deterioration in real incomes which may tempt even more to enter the workforce while companies may reassess their recent labor hoarding especially if banks start to be even warier about lending.
.