U.S. Deficit and Government Debt Concerns
The large U.S. budget deficit has helped push up 10yr real yields to 2% in 2024/2025, but both the budget deficit (heavy issuance) and government debt trajectories (sustainability and rating concerns) are key going forward if the 10yr budget bill passed is similar to the House Bill. Foreign accounts could also demand high mid to long-term yields as they are upset with Trump administration’s adverse and erratic policymaking; concerned they are overweight U.S. assets and factoring in a multi-year USD downtrend. We are thus modestly revising up our 10yr yield forecasts to be centered around 4.5% in the next 6-18 months, with 30yr at some stage rising to 5.25-5.50% yields.
Figure 1: U.S. Government Debt Projections (% of GDP)
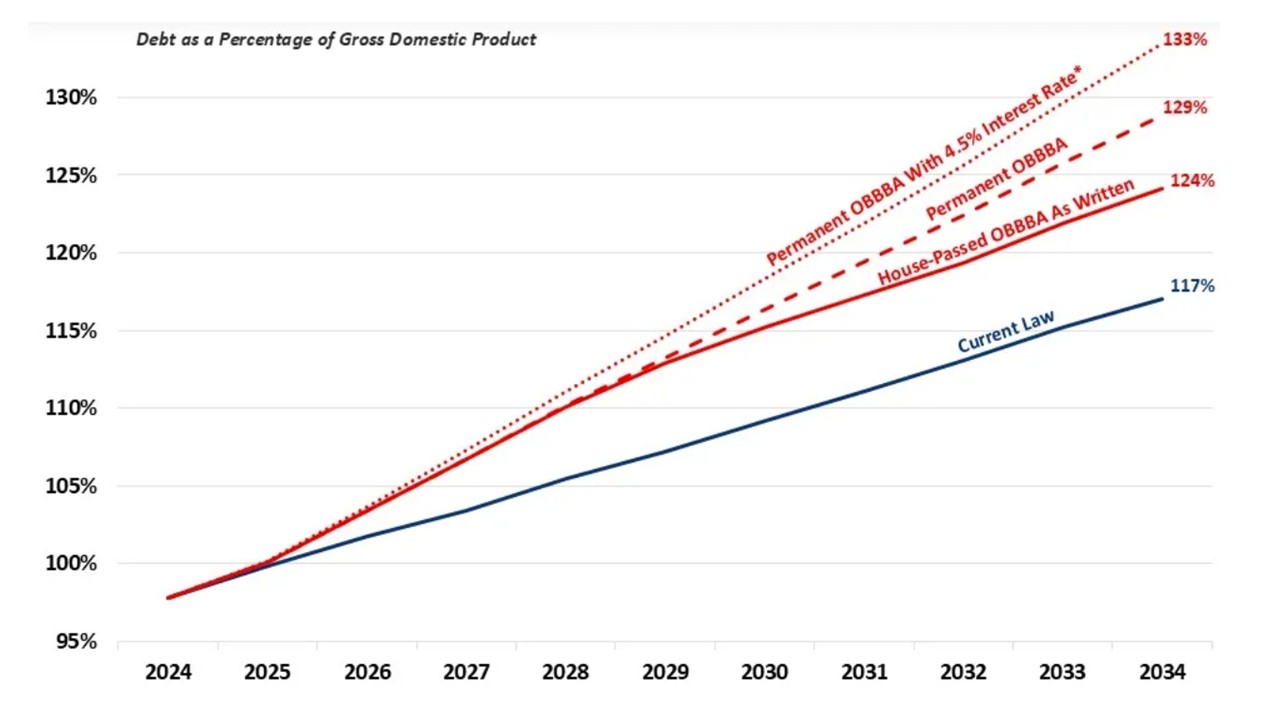
Source: CRFP (here)
The bond market is not happy with the trajectory of the U.S. budget deficit and government debt under the prospective President Trump 10yr budget bill (here). How will this play out in terms of short/mid and long dated U.S. Treasury yields in the coming quarters?
· Government debt projections likely to be revised up. The CBO later this year will revise estimates of the budget deficit based on the cumulative 2025-34 effect of the Big Beautiful Bill when it passes, but their initial estimate on June 4 was USD2.4trn (here). The CRFP have estimated that government debt to GDP will rise from 100% of GDP in 2025 to 124% in 2034 instead of the current 117% baseline (Figure 1). Some of the expenditure increases are due to lapse in 2028 and debt would be higher if the expenditure is made permanent or if bond coupons remain around 4.5% in the 10yr area. However, the trajectory could be lower once tariff revenue is factored in. The CBO estimate of USD2.8trn tariff revenue for 2025-34 published June 4 (here) is too high, as it is based on penal China tariffs that were removed May 14. USD1.0-1.5trn is a more reasonable working estimate of 10yr of tariff revenues, net of economic slowdown and tariff avoidance.
· Heavy New Issuance with 7% Budget Deficit. The budget deficit is also important with a prospective 7% budget deficit for 2026 and 2027 if most of the House bill is passed by the Senate and reconciled successfully in the coming months by the autumn. The Trump Musk fallout could delay budget bill passage, but in the end the approach of the mid-terms will likely mean a 10yr budget deficit increase similar to the current House bill. This would increase already persistent and large new issuance by the U.S. Treasury. Though the budget deficit was much larger in 2020, Fed QE was 10.4% of GDP and this reduced the net new supply to the rest of the market (Figure 2). The budget deficit +/- QE/QT was 7.7% of GDP in 2009 and 2010 (Figure 2), which was accompanied by low to negative real yields (Figure 3) but this was due to the aftermath of the GFC that prompted ultra-easy money and risk aversion among investors/households. The U.S. could finance a 7% budget deficit at lower than current real yields, but this would require a hard economic landing. On our baseline of a slowing in the economy to below trend 2025 and 2026, we feel 2% plus real yields are required at the 10yr area and more for the 30yr. The early 2000’s saw 2% real 10yr yields as well (Figure 3), but the budget deficit averaged around 2.2% in 2003-07.
Figure 2: U.S. Federal Deficit to GDP with and without QE/QT to GDP (%)
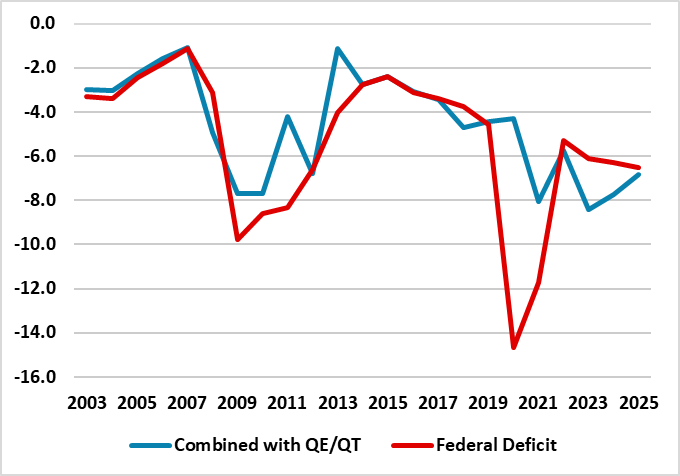
Source: Datastream/Continuum Economics
Figure 3: 10yr Real Bond Yields from TIPS (%)
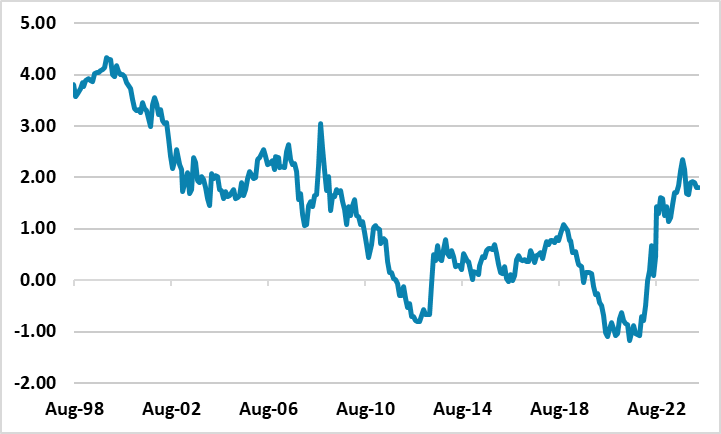
Source: Bloomberg/Continuum Economics
Is the budget deficit or government debt trajectory more important for the U.S. Treasury market? Moody’s downgrade of the U.S. has prompted a lot of focus on the government debt trajectory. Normally a push to 120% of GDP would not be a problem at current real yields, as the USD will likely remain the global reserve currency in the next 5-10 years. However, global investors hold USD8.5trn of U.S. Treasuries (here) and are upset with Trump administration’s adverse and erratic policymaking; concerned they are overweight U.S. assets and factoring in a multi-year USD downtrend. This means that the U.S. may have to pay a higher risk premium in 10 and 30yr real yields than in the past. The budget deficit is also important as say a 5% rather than a 7% budget deficit could help reduce upward yield pressure. However, this is unlikely to happen, as the Senate and budget reconciliation will likely only fine tune the prospective 2026 and 2027 budget deficits. The answer is that both the budget deficit and government debt trajectories are important. The large budget deficit has helped get to 2% 10yr real yields in 2025, but both are key going forward.
Figure 4: 30-5yr U.S. Treasury Yield Curve (%)
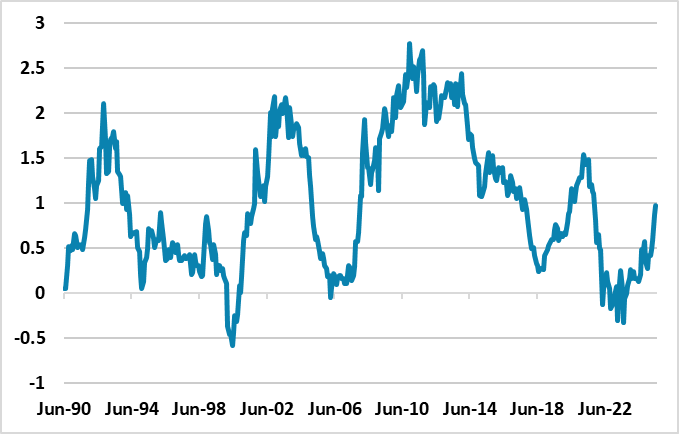
2 and 5yr will remain dominated by the Fed leaving the door open to further rate cuts and then actually cutting. This can bring 2yr down into 2026 (Figure 5) and can hold 5yr yields or see them decline. 30yr yields will likely rise further on a 3% plus inflation/1.25-1.5% growth scenario and we look for a further rise. The U.S. Treasury will likely reduce the proportion of funding in the 30yr and could increase bond buy backs of old issues, but this will not stop the trend upwards in yields. The 30-5yr U.S. Treasury curve is not particularly steep by historic standards (Figure 4).
What about 10yr yields? 10yr yields face a tug or war. The front end of the curve into 2026 can see lower yields that acts as a force to drag yields down and some of this can be seen into Q3 with soft economic data. However, 2% real yields for 10yr may not be high enough, both with the persistent heavy issuance and foreigners less willing to invest in U.S. Treasuries without extra risk premium. The 1998-2002 period saw an average of 3.5% 10yr real yields in the days before heavy EM purchases of Treasuries from 2003 onwards. It could be that the cyclical conditions means that 2% is the right real yield, but we feel that 2.0-2.5% real yields could be required. With 10yr breakeven inflation of 2.3%, this translates into 10yr nominal yields centered around 4.3-4.8%. We are thus raising our 10yr yield forecasts modestly (Figure 5), especially in 2026 when the tariff storm will be past its worst. The one caveat for fixed income investors is that the main alternative scenario (20-25% probability) would be a harder landing that sees aggressive Fed easing and 10yr yields coming down to 3.25-3.50%, with debt concerns being overlooked.
Figure 5: Fed Funds, 2, 10 and 30 U.S. Treasury Yields Forecasts (%)
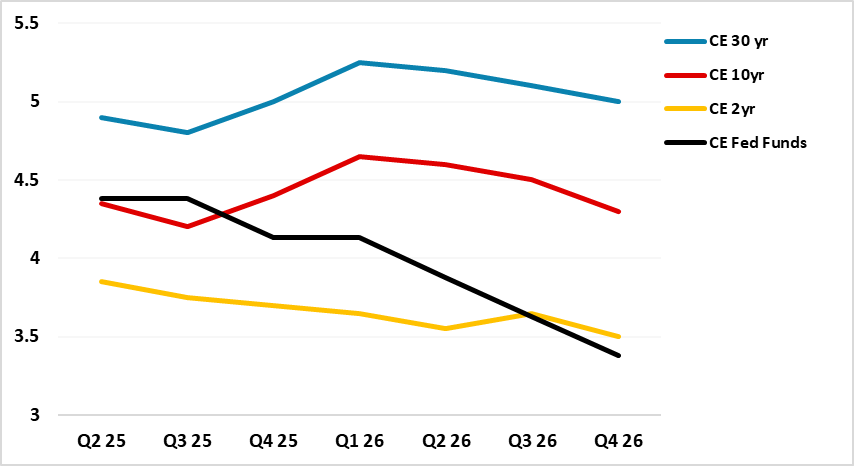
Source: Continuum Economics