Trump’s Policies and U.S. Equities
Models would suggest that the current and prospective direct tariff impact should slow GDP growth to a 1.5% pace, which should see slow Fed easing in 2025 given the boost to inflation. However, the policy uncertainty means that business and consumer behaviour could see a large adverse hit that keeps the equity market worried about the harder landing scenario. We see scope for the selloff to extend through the spring to 5200 on the S&P500, as Trump introduces new product and reciprocal tariffs from April. We now look for 5700 by end 2025.
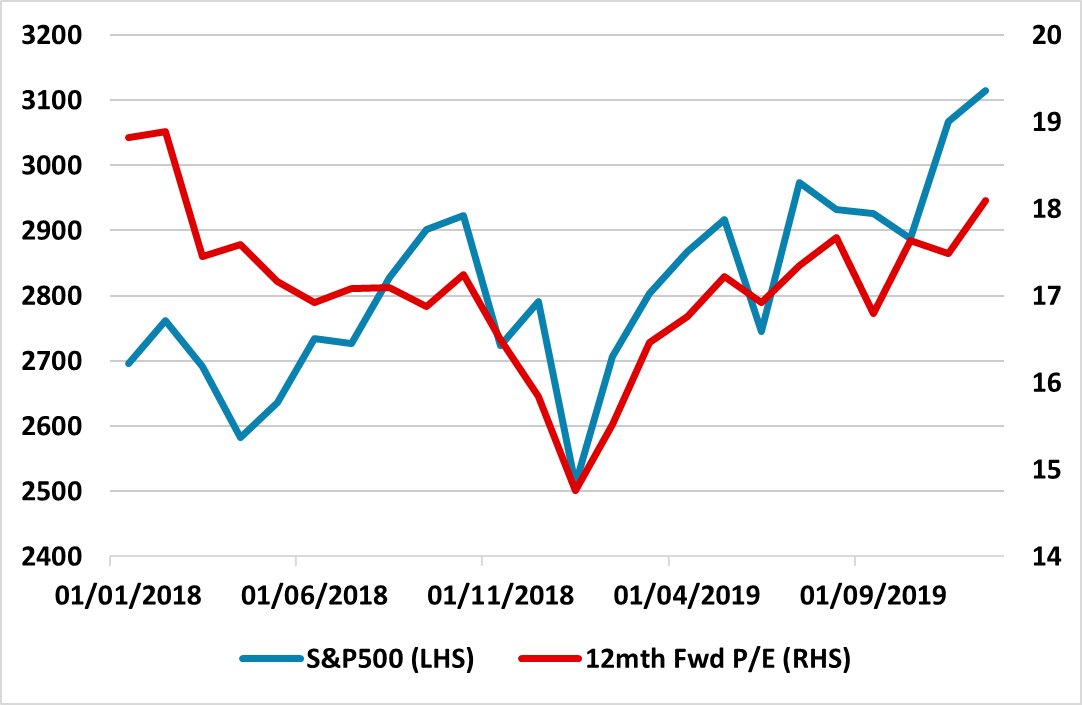
Figure 1: S&P500 2018-19

Source: Datastream
The U.S. equity market is not happy with the Trump administration implementation of tariff policy. Adjustment is occurring to market participants thinking. Some tariffs are now expected to be permanent (for tax revenue purposes and to shift production back to the U.S.) plus some potentially temporary (to get trade concessions). With more product tariffs expected at 25% in April and reciprocal tariffs, the breadth and pace are wider than 2018 when it largely focused on China (Figure 2) after the initial steel and aluminum tariffs. Additionally, policy uncertainty has increased, with a more chaotic process of late announcements and delays than in 2018. Moreover, the success of any production switch to the U.S. will vary, as some products have no or limited U.S. supply currently. This likely means higher prices, less demand in the U.S., delayed investment and softer GDP. Finally, Trump decision to have a trade war with multiple countries at the same time risks demand for U.S. exports being hit, with a backlash in Canada and against Tesla in Europe.
Figure 2: Chronology of U.S./China Trade War
| Aug-17 | USTR investigates China trade |
| Jan-18 | US imposes tariffs on China solar panels and washing machines |
| Mar-18 | U.S. imposes tariffs on steel and aluminium tariff across many countries |
| Apr-18 | USTR issues report under 301 report and U.S imposes tariffs and China counters on select goods |
| May-18 | Trump threatens to impose tariffs on extra USD100bln of goods and China agrees to substantially reduce trade deficit with U.S. |
| Jun-18 | U.S. impose 25% tariff on USD50bln on China goods in July/August 2018 and China announces similar counter tariffs |
| Sep-18 | U.S. announces 10% tariff on USD200bln of China goods with threat to increase to 25%. China announces 10% tariff on USD60bln of U.S. Imports |
| Nov-18 | USMCA comes into effect with rules of origin to protect U.S. automobile industry |
| May-19 | U.S. increases tariffs on USD200bln to 25% |
| Jun-19 | Presidents Trump and Xi agree truce at G20 summit |
| Jul-19 | China announces target of reducing U.S. Treasury holdings by 25% |
| Aug-19 | Trump threatens to Impose tariffs on extra USD300bln of goods and USD112bln take effect Sep 1 2019 at 15% |
| Aug-19 | Yuan depreciation accelerates and US declare China a currency manipulator |
| Oct-19 | Trump announces first phase trade deal with China, which comes into effect Feb 2020. |
| End 2020 | 58% of targets meet by first phase deal, due to COVID pandemic |
Source: Continuum Economics
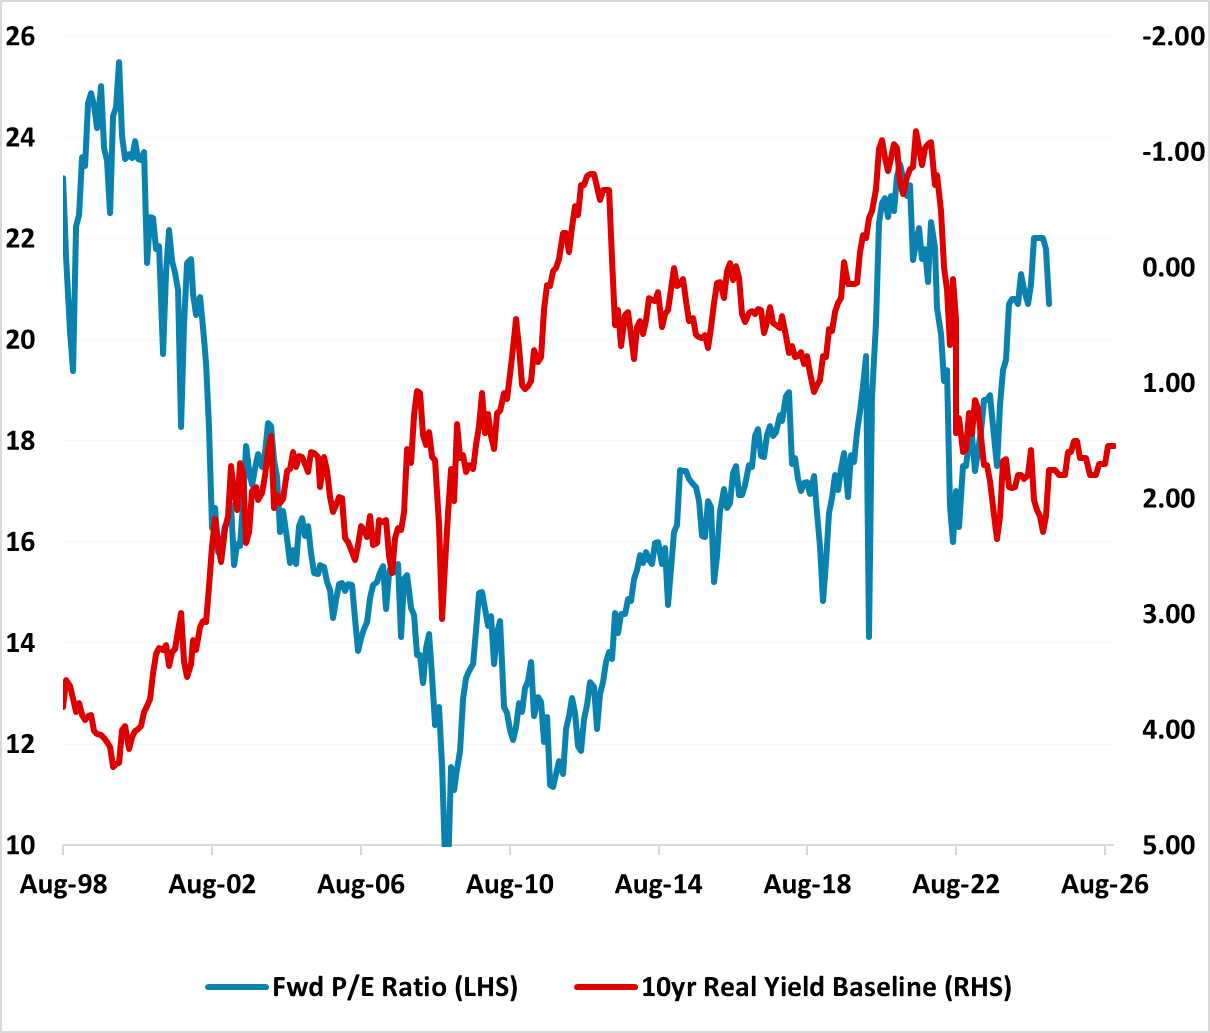
For the U.S. equity market, the administration view that some pain will occur to a transition to a better future has also removed ideas that a falling equity market would stop tariff implementation – no Trump put yet. The question is now where will the U.S. equity market reach a bottom. In 2018-19 the deterioration in business sentiment fueled the market correction, which also brought the fwd P/E ratio down to 15 (Figure 1). Despite the current selloff from the highs the 12mth fwd P/E ratio for the S&P500 is still a high 20.7. The AI boom could help the bottom fwd P/E ratio to be higher in the current correct but is that 19? or 18? The 12mth fwd S&P500 P/E ratio is also way out of line with 10yr real yields (Figure 3) – based on 10yr yields staying in the 4.0-4.5% area. 18 is consistent with 5150 and 16 with 4576 on the S&P500.
Much depends on incoming economic numbers over the next couple of months. If they show a soft landing for the economy, then the equity market correction can slow. Alternatively, any major data that backs a hard landing idea can raise recession fears and a larger correction below 5000 can be seen, driven by P/E multiples reduction. Models would suggest that the current and prospective direct tariff impact should slow GDP growth to a 1.5% pace, which should see slow to gradual Fed easing given the boost to inflation. However, the policy uncertainty means that business and consumer behaviour could see a large adverse hit that keeps the equity market worried about the harder landing scenario. High yield debt also looks to be blowing out to 400bps versus Treasuries on the economic jitters and this can feedback to hurt the equity market. Trump could also get worried about a harder landing for the economy and equities and do a U turn on some tariffs. We see scope for the selloff to extend through the spring to 5200 on the S&P500.
The market should recover in H2, as the Trump administration gets down to negotiations with key countries including Canada and Mexico. However, some tariff increases will be permanent as Trump also wants to raise tax revenue from tariffs and also try to shift production back to the U.S. Additionally, the House 10yr budget bill is likely to be neutral for the economy rather than stimulative, due to spending cuts. Finally, the sharp slowing in new immigration can add to a slowing of employment growth, while the bad PR over the restructuring of the Federal government also seems to be adversely impacting business and consumer sentiment. This will create a headwind to the economy for 2026 and less willingness to accept U.S. exceptionalism in the equity market. We now look for 5700 by end 2025.
Figure 3: 12mth Fwd S&P500 P/E Ratio and 10yr Real U.S. Treasury Yield Inverted (Ratio and %)

Source: Continuum Economics with forecasts to end 2026