Eurozone Flash GDP Review: The Haves and the Have-Nots
It continues to be the case that, for an economy that has seen repeated upside surprises and apparently above trend growth, now some 1.3% in the year to Q3, GDP data do not seem to have had much impact is shaping, let alone dominating, ECB policy thinking save to encourage a Council view of EZ economic resilience. The Q3 rise of 0.2% q/q may have bettered ECB thinking, but we would caution the ECB from taking too much positivity from the GDP backdrop, as we think it will only engender even more policy complacency. Indeed, we remind that EZ underlying growth has been nowhere need that of the recorded headlines, actually averaging no more than the 0.2% Q3 outcome, ie half what the y/y rate would suggest. Moreover, divergences are even clearer not just between the likes of (still stagnant) Germany and immigration-induced Spanish strength but also with France having to rely on exports to accomplish the moderate growth seen of late. Even so, the Q3 figure, at least arithmetically, does imply faster average EZ 2025 growth – we have upgraded the picture by 0.2 ppt to 1.3% but retain our 0.8% 2026 call.
Figure 1: Better But Still Divergent and Lacklustre EZ GDP Picture?
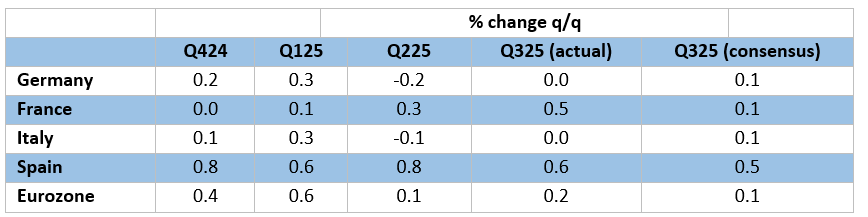
Source: Eurostat, Continuum Economics
Instead, and for the time being, we think that the ECB will remain in a much more risk management frame of mind and where policy freedom has been granted by clear disinflation – actual and that yet to come. Those risks are obviously (but not solely) centred around the tariff outlook but also reflect a fuller and more sobering assessment the overall EZ monetary stance and the transmission mechanism in particular.
Notably, that apparently above-trend growth in the last year came alongside what has been significant disinflation, this very much supporting our long-held view that weaker price pressures of late have been mainly supply driven and thus where weaker demand ahead could prolong, if not accentuate, such disinflation. But if course, that would be a simplification as underlying growth has been much worse at around half the recorded Q3 1.3% y/y rate
Underlying Growth Still Tepid?
The ECB contends that the EZ economy has shown resilience of late. But the ECB will be as aware as everyone the extent to which recent GDP numbers may be giving a misleading picture, actually offering little insight into underlying activity. Indeed, recent GDP data gains have been predicated on both a surge in Irish GDP as well as what was seems to have been an inter-related EZ export jump in anticipation of the US tariff imposition from April. In fact, EZ GDP growth has been very dependent upon Ireland for the last year, the latter accounting for half the y/y growth seen into Q3 and where the ex-Ireland q/q rate has averaged less than 0.2% q/q for more than the last two years. This makes our 2026 GDP projection of 0.8% easier to understand as it merely extrapolates from recent trends. Moreover, to us this soft outlook suggests that the profile for GDP will have made little inroad in the EZ output gap. Regardless, the data do suggest a marked pick-up in productivity growth has occurred of late, which may be somewhat more persistent given the labor hoarding the EZ economy has seen in the last few years.
Figure 2: EZ Growth Inc and Ex Ireland
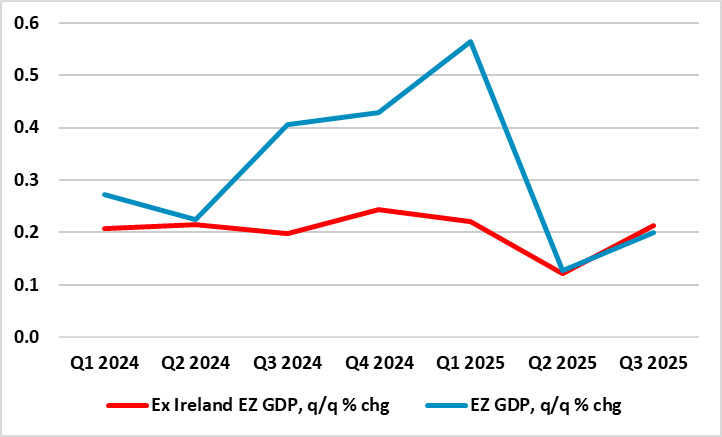
Source: Eurostat
I,Andrew Wroblewski, the Senior Economist Western Europe declare that the views expressed herein are mine and are clear, fair and not misleading at the time of publication. They have not been influenced by any relationship, either a personal relationship of mine or a relationship of the firm, to any entity described or referred to herein nor to any client of Continuum Economics nor has any inducement been received in relation to those views. I further declare that in the preparation and publication of this report I have at all times followed all relevant Continuum Economics compliance protocols including those reasonably seeking to prevent the receipt or misuse of material non-public information.