EM Rates: Domestic Fundamentals Dominate
Once trade is agreed with the U.S., the good fundamentals actually argue for a 10yr Mexico-U.S. spread close to 400bps and this is our favored strategic risk reward for big EM government bonds. In Brazil a case can be made for a 12.75% policy rate end 2026 and 10% in 2027, but this could only mean 12-13% 10yr Brazil yields versus 14% currently. We would see this as a two tactical opportunity in H1 2026 and again in 2027 when BCB starts cutting rates, as the strategic fiscal questions needs to be clearer long-term. In S Africa with uncertainty about the coalition and future fiscal consolidation, 10yr yields could find it difficult to break below 9.25-9.50% in the next 6-12 months. Finally, PBOC resistance to further monetary easing points to a flat yield curve and continued low nominal yields.
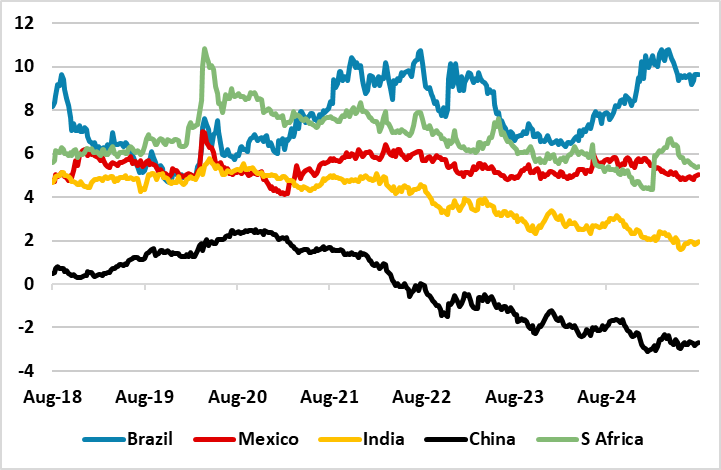
Figure 1: 10yr U.S. Treasuries versus Key EM Countries (%)
Source: Datastream/Continuum Economics
The USD downtrend in 2025 against DM currencies has spilled over to EM, but with a more mixed impact on key EM currencies YTD, as President Donald Trump has been more aggressive on tariffs with China/India/Brazil/S Africa than key DM countries – Mexico still remains at risk from further tariffs. Even so, the fact that the USD is not in an uptrend has prompted carry trades in the money market and bond buying at the long-end in Brazil/Mexico and S Africa given wide spreads and anticipation that easing cycles could mean narrower spreads versus the U.S. (Figure 1). India government bonds has benefitted as well and also been helped by bond indices inclusion but restrained by the nasty twist in trade relations with the U.S. (here).
Nevertheless, domestic conditions dominate, which is partially shown by yield curves (Figure 2). China flat yield curve reflects the aggressive disinflation from excess supply versus demand and anticipation that the PBOC will not be aggressive (which would steepen the yield curve). PBOC are concerned that the 7 day reverse repo rate is low and are likely to only cut a further 10-20bps over the coming 18 months (we now only look for only one 10bps cut in H2 2026) and highly unlikely to launch full scale QE. Concern exists that banks interest margins could be squeezed too far and hurt lending growth. The focus is on the Yuan500bln extra equity capital for the six major state banks being used to expend lending; Yuan 10trn LGFV debt swap helping to normalize LGFV lending and avoiding a bank failure that hurts confidence. China is also reluctant to be aggressive with further fiscal policy, given the underlying deteriorating in the general government debt trajectory (Figure 3). This is better policy than cutting rates, but argues for a flat curve and current low yields to be sustained. We also see an eventual U.S./China trade deal (here), which should take some pressure off China policymakers into 2026. China low nominal yields are also a reflection of moral suasion by China policymakers with banks/other financial institutions and financial repression of domestic savers.
Figure 2: Key EM 10-2yr Curve (%) 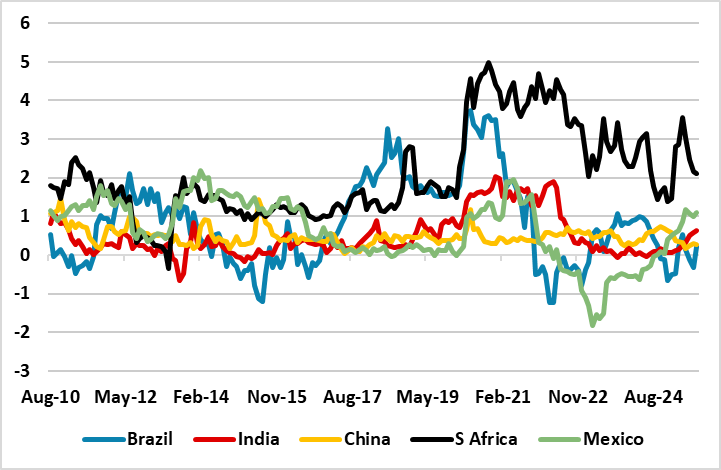 Source: Datastream/Continuum Economics (Mexico is 10-3yr)
Figure 3: Gross Government Debt/GDP (%) 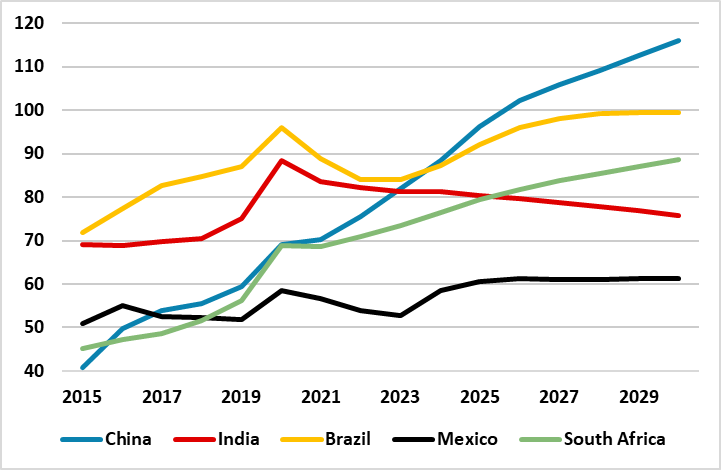 Source: IMF
India shows controlled yields helped by the RBI easing cycle and also high nominal GDP in the coming years expected to control the government debt/GDP trajectory (Figure 3). Provided that 10yr U.S. yields do not spike higher, a 10yr yield spread versus Treasuries of around 200-225bps could be sustained.
Mexico controlled fiscal trajectory means that the 10yr yield outlook depends on the macro picture and the Banxico easing cycle. We forecast a terminal policy rate of 7%, as Banxico slows the easing cycle and also as they are concerned about core CPI pressures still and the long-term rate differentials versus the Fed Funds rate. Trump also wants to renegotiate USMCA that will sustain the current risk premia. Nevertheless, once trade is agreed with the U.S., the good fundamentals actually argue for a 10yr Mexico-U.S. spread close to 400bps and this is our favored strategic risk reward for big EM government bonds. S Africa and Brazil suffer from concerns over the long-term fiscal trajectories with a steep S Africa yield curve and elevated real Brazilian yields. Brazil pressure can ebb once BCB starts the easing cycle in 2026, but we only see 275bps of cuts in 2026. BCB is concerned over core inflation, but also the outcome of the October 2026 election – Trump selective 50% tariffs have boosted Lula in the opinion polls. A case can be made for a 10% policy rate in 2027, but this could only mean 12-13% 10yr Brazil yields versus 14% currently -- variations depends on fiscal news. We would see this as a two tactical opportunity in H1 2026 and again in 2027 when BCB starts cutting rates, as the strategic fiscal questions needs to be clearer long-term.
S Africa SARB will now be more cautious in cutting interest rates to establish credibility of its new lower 3% inflation target (here). We do see a further 50bps reduction in 2026 to a 6.5% policy rate. Normally such a policy rate would mean a 10yr-SARB policy rate spread of around 200-250bps i.e. 8.50-9.00% 10yr yields (Figure 4). With uncertainty about the coalition (here) future fiscal consolidation, 10yr yields could find it difficult to break 9.25-9.50% in the next 6-12 months. However, if fiscal consolidation gets back on track and the SARB is largely successful in meeting 3% inflation, then real and nominal yield premia could be lowered.
Figure 4: S Africa 10yr-SARB Policy Rate and Inverted SARB Policy Rate (%) 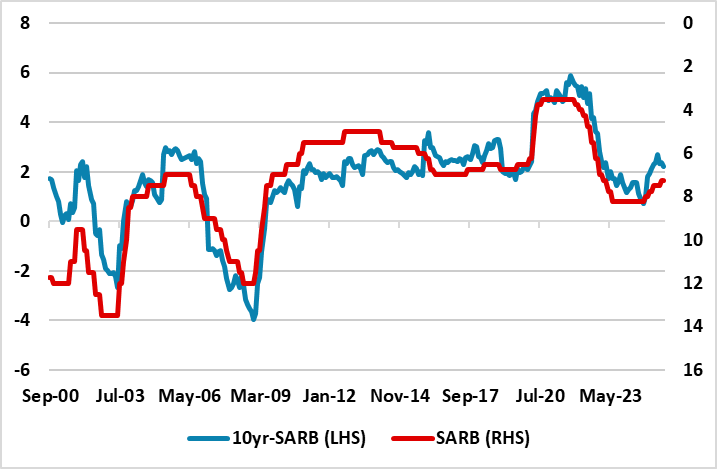 Source: IMF