A Harder Landing and the Fed
Though our baseline view is for a soft landing for the U.S. economy and the Fed cutting to 3.00-3.25% by end 2025 (here), uncertainty exists over the scale of the slowdown. If the U.S. economy has a harder landing (stagnation/technical recession with 20-25% probability), then the Fed could likely cut the Fed Funds rate to 2.50% or below in 2025. A skew exist to lower Fed Funds depending on the outcome of the economy.
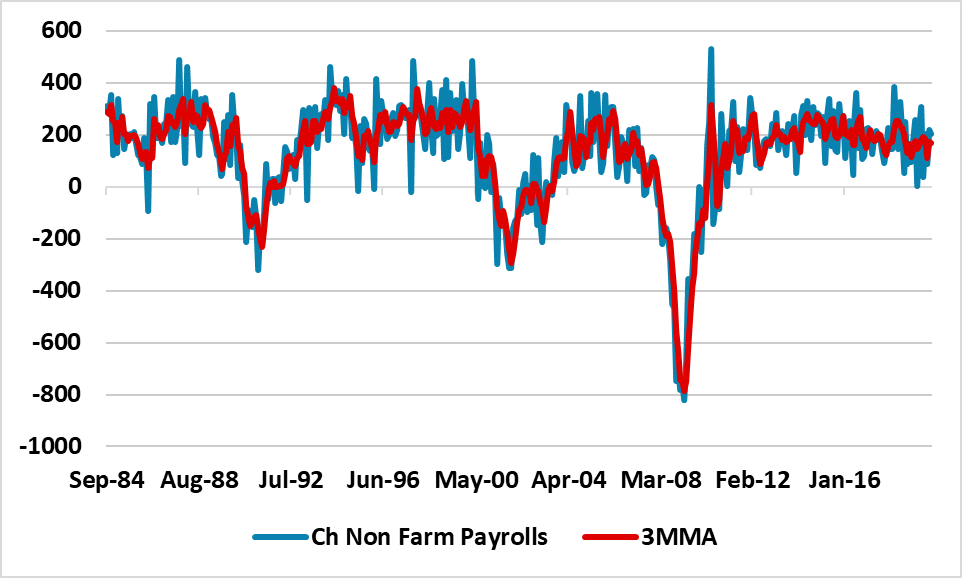
Figure 1: Change in U.S. Non-Farm Payroll and 3M Moving Average (000’s)

Source Datastream/Continuum Economics
The FOMC face uncertainty over the scale of the slowdown. The broad view is for soft landing, given momentum in consumption and still reasonable employment growth. Wealth effects are also supporting most consumers. Nevertheless, the slowdown is not uniform and occasional volatile numbers raise the question of whether a harder landing is occurring. We would classify harder landing as a move to stagnant growth or a technical recession, which would be circa 20-25% probability. A moderate or larger recession remains lower risk. The prime catalyst for a harder landing is that the lagged effects of Fed tightening kicks in stronger with a lag. The struggle of low income households, plus growing business caution in some surveys (e.g. ISM manufacturing) means that this is something that the market and the Fed will debate over the next few months.
What kind of data could cause alarm for the Fed. The focus should be more on the real sector side. The slowdown in the economy should bring some disinflationary benefits into 2025, while China is also exporting disinflation via the push to boost export growth given excess production. The Fed assessment will be a broad review of data, both as it allows the Fed to compare and contrast and as it gives a feel to the key question of how much the economy is slowing down. Nevertheless, Fed chair Powell has been clear that the Fed would be uncomfortable with a quicker slowing in the jobs market, which increases market sensitivity to the employment reports (establishment and household data); initial claims; JOLTS; quit and hiring rates. The comprehensiveness of the establishment data survey means that the non-farm payroll (NFP) will remain potentially the most sensitivity. Chart 1 shows that the change in NFP can be volatile (we have excluded the period beyond 2020 to show the movements more clearly). A negative payroll in May 1995 led to a slower average pace and helped trigger the 1 Fed cut in 1995 within a soft landing. If a low positive NFP (e.g. sub 100k) is followed by another low positive NFP then this could be more serious, if it drags the 3m moving average below 100k pm. A sub 100k trend threatens to accelerate the slowdown by hurting income and consumption growth. The Fed could also be sensitive to a couple of numbers in the low 100’s. Does the present inflation picture (Figure 2) restrain the Fed?
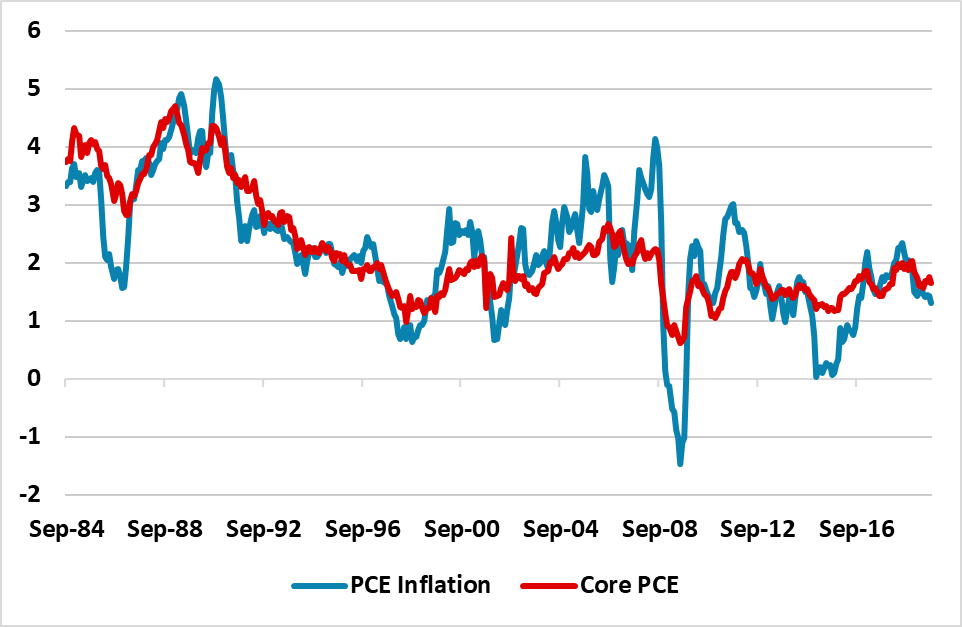
Figure 2: PCE and Core PCE Inflation (%)

Source Datastream/Continuum Economics
Though core PCE is above 2% currently, the Fed and other forecasts are looking for a slowdown in 2025 – the June SEP median was 2.3%. Add in disinflation pressure from the slowdown and the Fed will likely feel unrestrained and react on whether it feels the overall data is pointing to a soft or harder landing. We have penciled in 25bps starting Sep 18 and then 25bps at the next six meetings before slowing to a quarterly pace in H2 2025. However, weak data could shift the mood in the FOMC to 50bps at the September or subsequent meetings this year, as the Fed would want to front load easing if it becomes more worried about a harder landing.
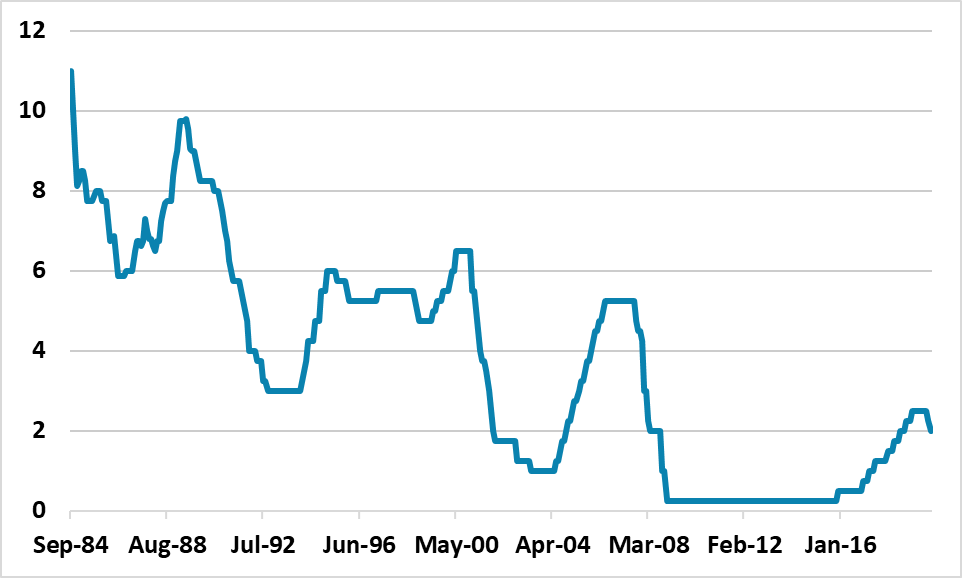
Additionally, it would likely mean a lower terminal policy rate if we see stagnation or a technical recession. While cumulative easing could depend on this distinction between stagnation versus a technical recession, the Fed would likely move quickly to a 2.5% Fed Funds rate and could cut as low as 2.0% or 1.5%. In this scenario of a harder landing, 1990-91 or 2000-01 perhaps give a better guide compared to 2008 or 2020 (Figure 3).
Figure 3: Fed Funds Target (%)

Source Datastream/Continuum Economics