Eurozone Flash GDP Preview (Apr 30): Softer Even Before Iran Conflict?
We have been critical of the ECB assertion (at least before the Iran War) that the EZ economy was in a ‘good place’. This to us was too backward looking and amid some signs in both hard, soft and monetary data, that the economy going into the last quarter was slowing. Indeed, part of a broad slowing across the EZ (Figure 1), we see growth of just 0.1% in Q1, half that of the previous quarter, albeit the latter masking a backdrop where ex-Ireland EZ GDP growth has picked up in Q1 to a solid and above trend 0.4%, there by reversing a pattern event in previous quarters. This has been led by a clear pick up in capex growth, much of which has been led by housing. Notably this looks vulnerable, not only to the rise in effective rates but also to the gloomier sentiment in construction surveys and possible increasing bank reticence to lend. In fact, it has been increased bank wariness about lending seen more broadly over the last six months or so that has been possibly the prime factor behind our below-consensus growth outlook and criticism that the ECB has been (and is still being) complacent.
Figure 1: Softer But Still Divergent EZ GDP Picture?
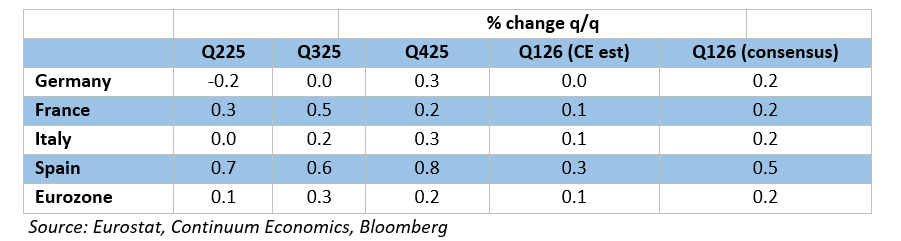
Source: Eurostat, Continuum Economics, Bloomberg
It continues to be the case that, for an economy that has seen repeated upside surprises and apparently above trend growth, now some 1.3% in the year to Q3, GDP data do not seem to have had much impact is shaping, let alone dominating, ECB policy thinking save to encourage a Council view of EZ economic resilience. However, some degree of resilience has been evident, especially given the manner in which ex-Ireland GDP growth has picked up by 0.2 ppt in H2 las year so that q/q growth on this basis (at 0.4%) was actually a touch higher than EZ GDP including Ireland – this being a reversal of the backdrop into H1 last year. In this regard, the ECB has become explicit in highlighting the ex-Ireland measure not just for its better message but also because it is less volatile. But it is also the case that country divergences persisted not just between the likes of (relatively stagnant) Germany and immigration-induced Spanish strength but also with France having to rely on exports to accomplish the moderate growth seen of late.
This better picture through H2 last year featured consumer spending picking up, this partly offset in terms of impact on GDP by a coincidental recovery in imports. But the star component has been gross fixed capital investment (GFCI), albeit this very much a repair job from marked weakness in the previous year and also partly a reflection of the Ireland induced swings in recorded activity. But it has featured a clear bounce in housing investment, the latter taking support from the fall in interest rates, albeit begging the question as to whether the recent rise back in rates, allied to what is ill sentiment in the sector will cause and such housing revival to be short-lived – as we think it will.
As for the last quarter, the business survey data has been mixed, albeit with the PMI data which tally better with an ex-Ireland GDP picture (Figure 2), suggesting a slowing has already occurred. Some of this is due the average PMI in Q1 encompassing March and the impact of the Iran War, but this is not the whole story. It has already been reported that the German economy fared poorly into Q1, but this is the case for the EZ as a whole too, most notably for industrial production which fell sharply in two of the three months to February. Construction too looks fragile while hitherto solid services have also slowed. One possible offset cloud be a fresh weakening in imports.
Figure 2: PMI and Ex Ireland EZ GDP
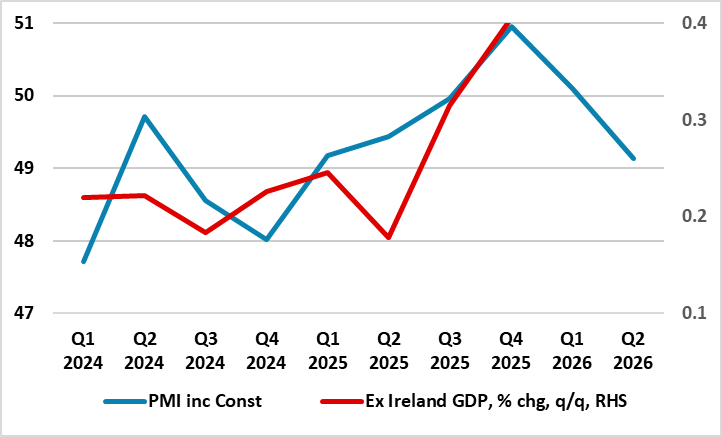
Source: Eurostat, Q2 PMI reading based on April consensus
GDP Flash Shortcomings
But the problem here is that there ie very little actual hard data to assess, let alone forecast, the Q1 backdrop. Indeed, amid a paucity of official data, it is important to recognize that there are clear shortcomings to any flash estimate for EZ GDP. No details come with these flashes and they are prone to clear revisions, where even a 0.1 ppt change (as occurred to the original Q4 estimate) can be very meaningful when the economy is hardly growing. They are based on incomplete activity numbers with usually only one monthly published value for services and two for construction and manufacturing. However, aggregating these three output sectors allows the creation of a monthly GDP proxy, albeit a figure that is volatile far from tallies with actual GDP outcomes. Ever so, this supports our 0.1) Q1 projection, pointing to a loss of momentum spilling over into the current quarter – as the PMI surveys suggest. Indeed, we see nothing better for the current quarter (and with downside risks given how the Iran conflict will pan out0. In the later regard – we for the time being stick with it lasting no more than eight weeks and we do note that retail fuel prices have started to fall back in the EZ.
Notably the Q1 GDP data are due on Apr 30, the same day ass April HICP flash numbers are due as well as the next verdict. For the reasons above regarding the lack of s detail and propensity for revision, the Council will not put much emphasis on these GDP numbers, especially as they are backward looking amid and increasingly uncertain outlook!