China Slowing LT Growth: Labor Force and Productivity Problems
China labor force will likely not grow in the remainder of the decade, due to falling population; reluctance to consider large-scale inward immigration; a female participation rate that is high by EM standards and limited growth in employment among those over 55. Meanwhile, education and rural to urban migration help China productivity, but the overall productivity trend will remain towards slowing as catch up gains become more difficult and due to only modest support from private companies/rule of law and lack of strong competition or openness. Structural long-term growth would likely slow to 3% by 2027, but actual growth will likely be modestly higher due to fiscal policy stimulation being used in 2025 and beyond.
Two key long-term growth drivers are labor force expansion and productivity growth. How will they shape long-term growth?
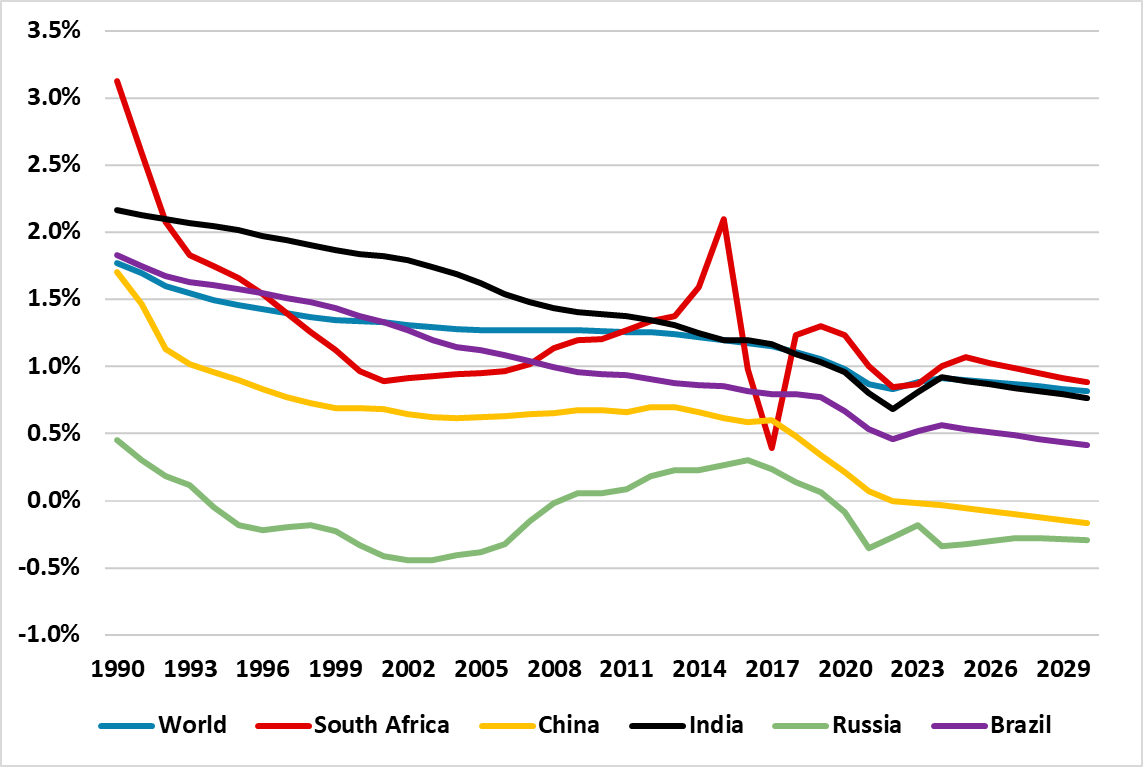
Figure 1: Population growth including net Migration (%)
Source: UN 2023/ Continuum Economics
One way to have consistently high growth is a fast increase in the labor force, which can drive employment/consumption and housing construction. Of the big EM, India is best placed, due to still good population growth (Figure 1); the demographic dividend of children currently coming into the labor force and scope for a healthy long-term increase in female participation. China has two headwinds and a challenge. Firstly, net population growth is turning negative in China (Figure 1) and it is politically highly unlikely that China will accept large-scale inward immigration. Secondly, female participation rates are high by EM country standards and not far below the DM average. Finally, the challenge is to increase the rate of over 55 working, given the low retirement age in China. Japan has shown that part time working and a focus on what older employees can contribute can both increase over 55 employment and allow a better work/retirement balance. China has finally passed plans to increase the retirement age by 3-5 years between 2025 and 2040 (here), which will help but is unlikely to produce a radical jump in over 55 employment.
All of this means that China labor force will likely not grow in the remainder of the decade, which reduces employment, consumption growth and the structural demand for housing – the IMF estimates that this will fall 35-55% (here). This is big structural headwind to growth.
Figure 2: GDP Per Capita Select Countries ($1000)
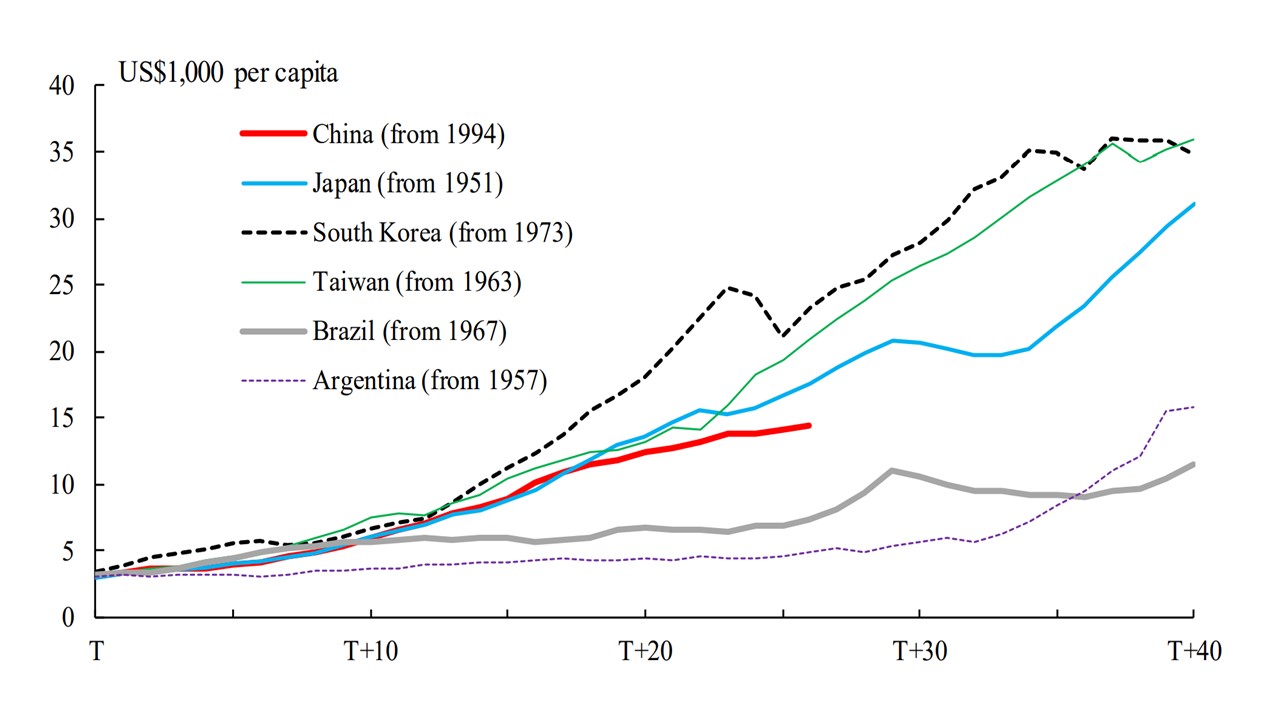
Source: BOJ Source: BOJ 2021 Year T is defined as the year when the GDP per capita of each economy surpassed US$3,000. Figures are based on output-side real GDP at chained PPPs (in mil. 2017 US$).
The second major driver is fast productivity growth, which was a key driver for East Asia economies in the past (Figure 2) but where Brazil got caught in the middle-income trap. China has an opportunity but also structural challenges from the shift away from private industries. The opportunity is that the shift from the rural to urban community is not yet complete in China and is one of the catch up growth driver in the next decade. How this plays out depends on China authorities and whether it wants to accelerate this transition. Two game changers would be abolishing the Hukou control system and better structural safety nets (health/unemployment/ pensions) to help labor mobility to new growth sectors. However, the current indications from China’s authorities suggest that neither of these are policy priorities and China also wants food security, which see a desire to only have slow rural to urban migration.
The structural challenge to China on productivity is the shift away from private industries towards SOE’s and central/local government to drive the economy compared to the boom years of 1990-2019. China championing of high tech and renewables industries certainly helps, but the support for private businesses innovation and competitiveness are currently insufficient. Meanwhile, China AI helps, but is not a game changer as the main benefits come to replacing high-income workers and China has less than DM economies.
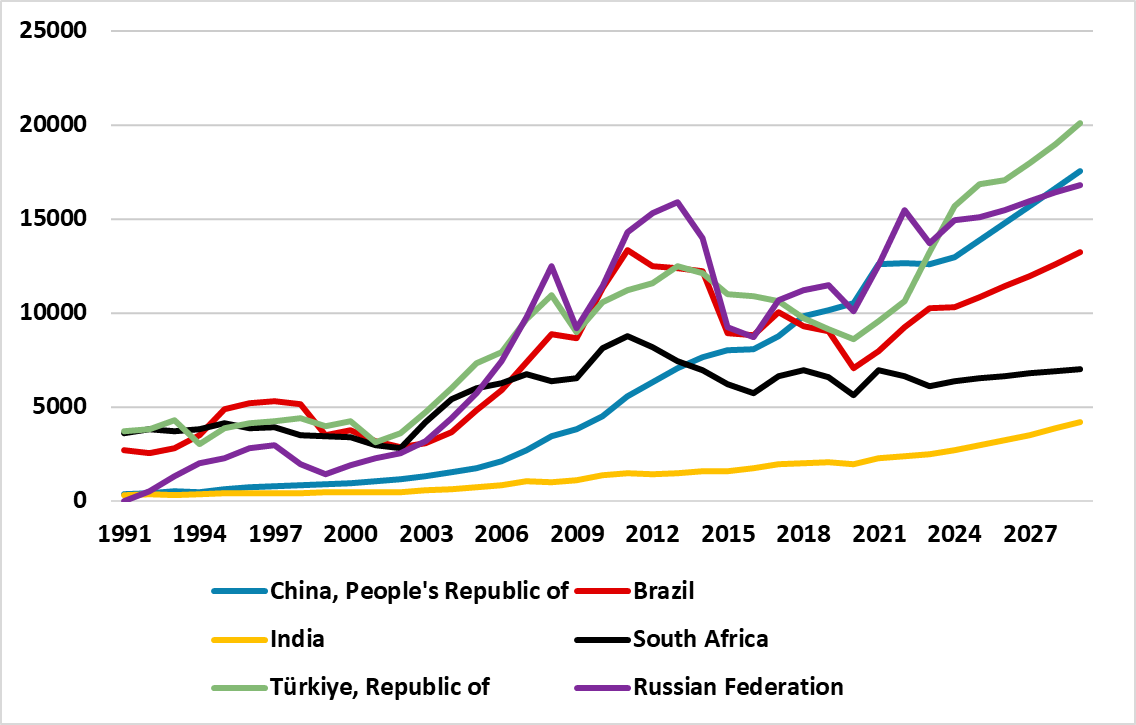
Figure 3: GDP Per Capita with IMF Projections (USD)
Source: IMF
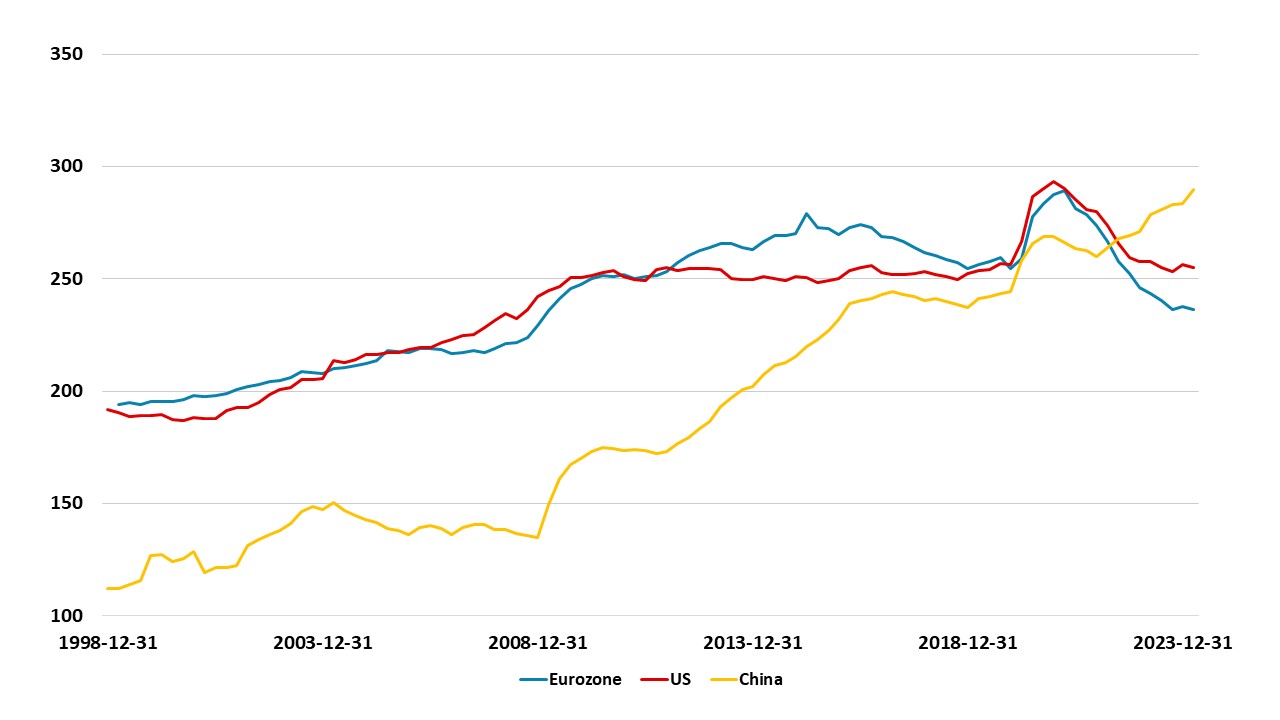
Studies on the long-term drivers of growth focus on 4 factors in the shape of strong macro stabilization policies; strong institutions and rule of law for private sector momentum; investment in education and human capital development and open and competitive markets. These are also key in moving from middle income to high income, where the big EM currently are (Figure 3). China has good rather than great secondary and tertiary education, which on balance is supportive to further catch up growth. However, China falls short of high-income economies standards for strong institutions and rule of law for private sector momentum and open and competitive markets. Finally, strong macro stabilization via monetary/fiscal and financial policies like the ones implemented in the past will be more difficult in the future with the high total government/household and corporate debt/GDP. This has risen sharply since 2008 and now exceeds the U.S. and EZ (Figure 4). Overall, we maintain the view that productivity will keep on slowing and is the 2 structural headwind to China growth. This all points to long-term structural growth slowing to 3% by 2027.
Figure 4: Total Government/Household and Corporate Debt/GDP (%)
Source: BIS/Continuum Economics
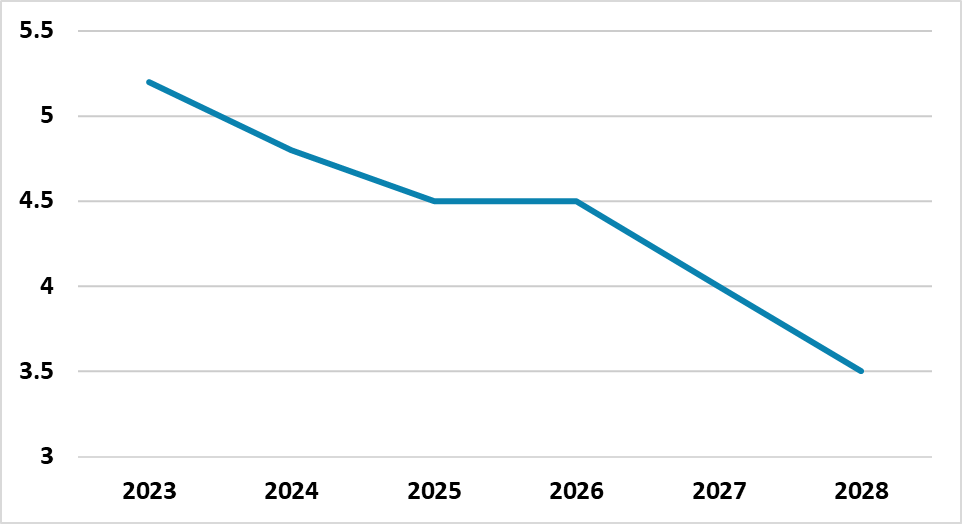
In terms of our long-term forecasts we also need to take account of stimulative policy. Monetary policy ineffectiveness is already evident in the limited impact on total social financial lending and private sector responses to PBOC moves. However, SOE and LGFV’s can borrow more and push up the total government/household/corporate to GDP ratio still further (Figure 4). China’s debt is dominated by the official sector on the debtors side by central/local government and SOE/LGFV’s (here) and creditors influenced by the state e.g. state owned banks. Japan total non-financial sector debt is 400% of GDP versus 290% in China! However, China authorities are reluctant to repeat the scale of fiscal stimulus seen in 2009-10. Thus, we look for some fiscal stimulus to boost overall growth above long-term growth trends in 2025-28 but at a modest pace. This shapes our long-term China forecasts in figure 5.
Figure 5: China Long-Term Growth Forecasts (%)
Source: Continuum Economics