Will China Deflation Depress GDP?
China most likely faces aggressive disinflation rather than Japan style deflation that depress GDP. China is a middle income country with incomplete urbanization/consumption, while China authorities appear more proactive than Japan in the 1990’s. However, support for households remains light, while production exceeds consumption momentum. This should see disinflation into 2025 and we forecast +0.6% for CPI inflation.
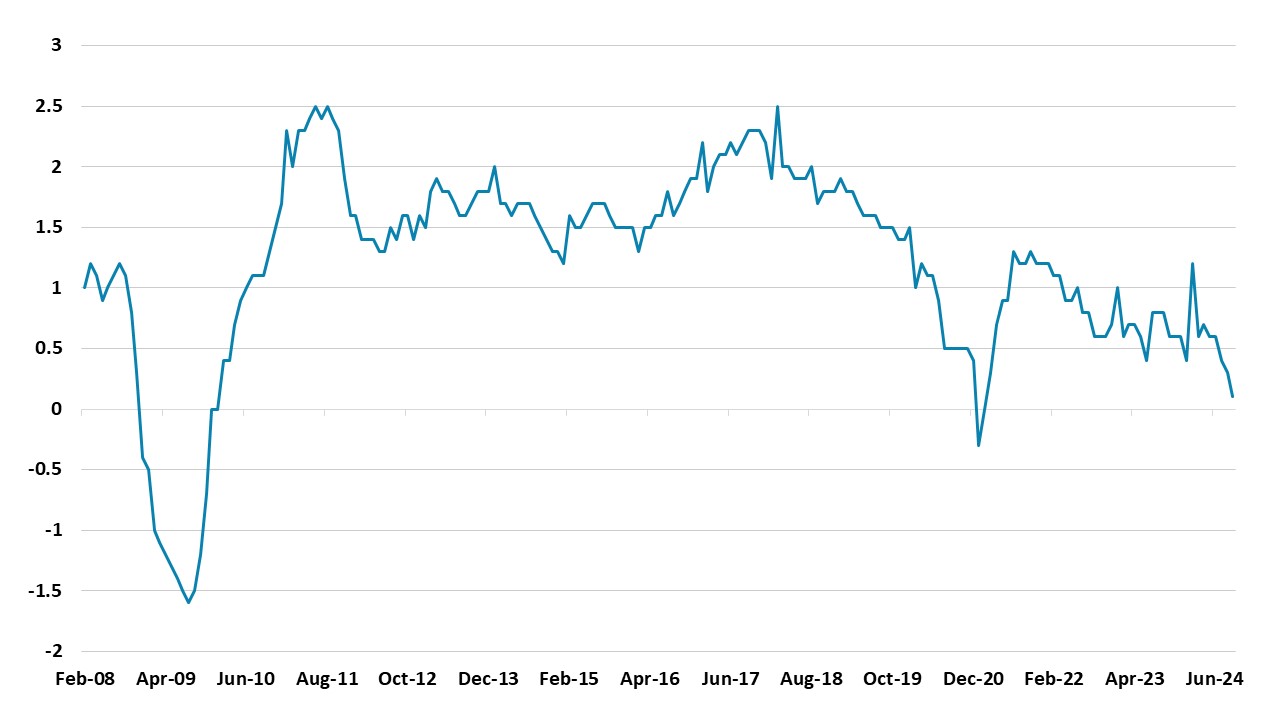
Figure 1: China Core CPI Yr/Yr (%)

Source: Datastream/Continuum Economics
China core inflation is a mere +0.1% Yr/Yr. The picture is worse with the GDP deflator that has seen persistently negative outcomes in recent quarters, though this could be distorted downward in breaking down nominal GDP and trying to hit the 5% real GDP target. Will China new stimulus packages help avoid the situation getting worse and China slipping into deflation?
The current aggressive disinflation is caused mainly by two factors
· Weak consumption and private investment. Consumption is being depressed not only by adverse wealth effects from the housing market (here), but also sluggish employment and wage growth that is causing high uncertainty and a bias to savings among households. Additionally, households remain concerned about insufficient structural safety net (e.g. unemployment/health/pensions) that is the main cause of the high savings ratio. Some households are debt restrained as well. Meanwhile, outside of high tech and renewables sectors, private companies optimism remains subdued by the government regulation crackdowns in recent years. This is also slowing employment growth, which is bad news as private businesses contributed most new jobs in the boom years.
· Excess production. China focus on output rather than balanced growth means that production exceeds consumption. One safety value is a surge in exports, but this could be very difficult if Donald Trump is elected U.S. president (here). Domestic production thus is causing disinflation pressures.
China authorities policy action have certainly become more proactive since September and with the fiscal announcement expected in early November (here) – this is being delayed until after the U.S. election results. We see circa Yuan2trn 2025 infrastructure spending and funds for local authorities to purchase completed homes for affordable homes. Reports that the Yuan2trn of government supported (gross) lending could be raise to Yuan4trn to finish incomplete homes would also be helpful. However, the monetary stimulus from the PBOC is unlikely to produce a prolonged boost, as households need excess inventory to be cleared and house prices to bottom before the housing market finds a true bottom. While an extra Yuan1trn to purchase complete homes would be a scale up, only a Yuan3-4trn spend would really clear the inventory and be a game changer. In the meantime monetary policy is less effective.
Looking at China policy objective it is clear that they want more impact in putting a bottom under the property market and also avoid major downside risks for GDP, as well as hitting the 5% GDP goal. The proposed Yuan1trn capital injection into the 6 biggest banks is also proactive (here). However, the overall scale of fiscal stimulus is not yet sufficient, but could be amended if Trump wins and congress is dominated by the Republicans. Without fiscal action beyond that suggested in news reports, the disinflation process will remain in China.
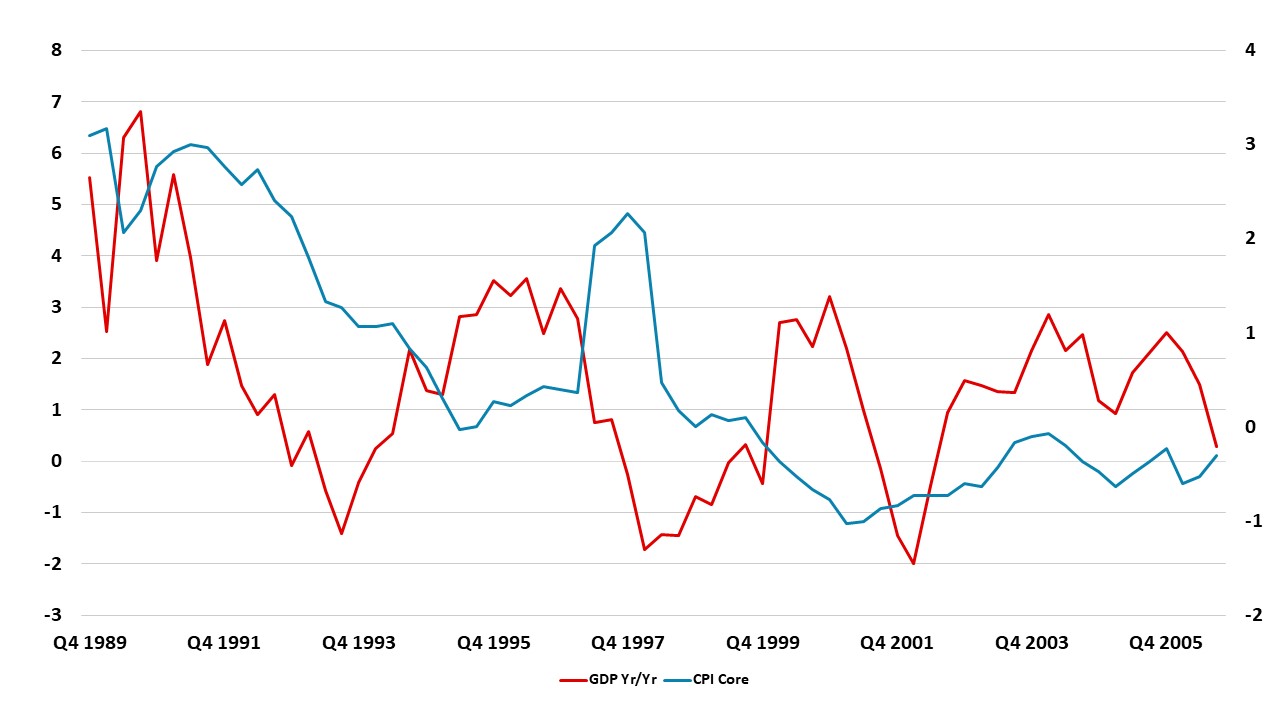
We would not see this as heralding a Japan style deflation, where persistent negative inflation caused consumption and private investment to be delayed – GDP was volatile due to intermittent government spending programs and external shocks (Figure 2). China is a middle income economy with incomplete urbanization/consumption in contrast to Japan high income status in the 1990’s. Additionally, China policymakers appear more proactive than Japan in the 1990’s and if the risk of deflation started to hurt real GDP then they would likely react. Even so, the disinflationary forces are sufficient for us to keep our 2025 CPI inflation forecast at 0.6%. The housing bust is bigger than Japan in GDP terms (here), while overall debt levels are excess for a middle income country.
Figure 2: Japan Core CPI Yr/Yr and Japan GDP (%)

Source: Datastream/Continuum Economics (1997-98 CPI core pick up was due to a consumption tax hike)