EM FX Outlook: Weathering the Storm
· EM currencies have seen a correction against the USD since the risk off prompted by the Iran war, but our baseline remains for a 4-8 week war (here) followed by energy prices only returning to pre-war levels by 2027 -- with WTI down to USD80-85 by June; USD65-70 end 2026 and USD60 by Q3 2027. Most EM currencies are helped by the inflation control seen during the Ukraine war, which adds credibility against excessive energy price volatility and inflation.
· Underlying fundamentals should come through later in 2026. We see scope for the Yuan (CNY) to appreciate further to 6.80 on USD/CNY, as China authorities allow some flexibility given external pressure over the size of the trade surplus. Elsewhere, we see the India Rupee (INR) stabilizing against the USD, alongside energy prices reversing and as RBI FX intervention acts against excess moves.
· In Latam, the Brazilian Real (BRL) will likely be choppy now ahead of the key October presidential election, but after the election rate differentials should drive USD/BRL to 5.10 by end 2026. The Mexican Peso (MXN) can see mid-year volatility, as Trump threatens Mexico during the USMCA renegotiations but we feel that the U.S. wants a renegotiated deal and this will see MXN recovering later in the year.
· In EMEA, the South Africa Rand can see a further correction however. The narrowing in bond yield spreads in 2025, plus flattening of the yield curve, means yield protection and the easy gains have been made. This should be viewed as a correction only though, as fundamentals are reasonable. TRY is attractive at first blush on a total returns basis as yield differentials exceed our depreciation forecast, but Iran and domestic political issues can make this a volatile ride.
· On a total return basis over the next 9 months, the BRL remains the clear standout, given the large differentials and a favourable and stable spot view. IDR looks oversold on global risk off, and as we expect the USD multi-year downtrend to resume against DM currencies and hurt USD sentiment against certain low inflation EM currency.
Figure 1: 9mth Total Returns Versus the USD (%)
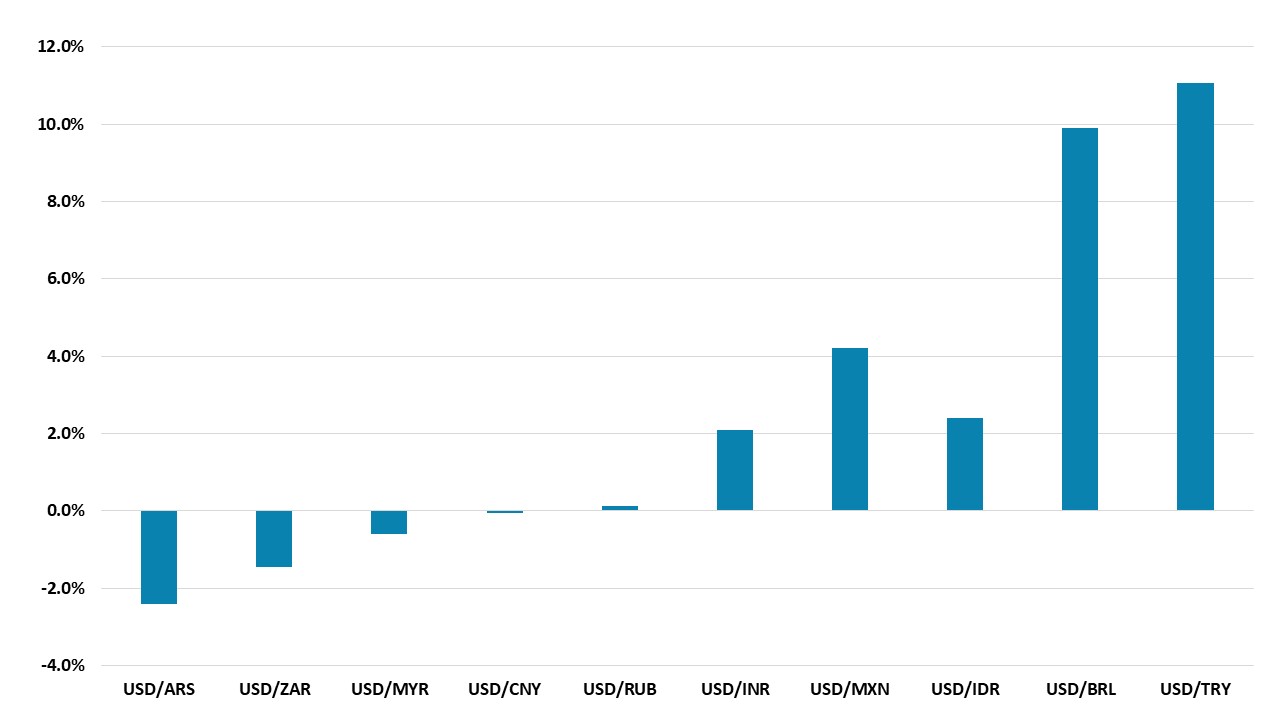
Source: Continuum Economics
Asia
The Yuan has remained strong in 2026, with little complaint yet from China’s authorities. Part of this is a willingness to allow a modest Yuan appreciation in the face of the huge China trade surplus and pressure from U.S./Europe/IMF and others over an undervalued Yuan (falling export prices means that the Yuan has depreciated in real terms in the last few years, see Figure 1). Part of this willingness to allow appreciation is also designed to soften U.S. trade pressures and the risk of an aggressive section 301 action from the U.S. China wants the trade truce with the U.S. reconfirmed with the delayed President Xi and Trump summit in China. However, China is not keen on a formal trade deal that could incorporate numerical targets to reduce the bilateral trade surplus on a multi-year basis.
Figure 2: Yuan Nominal and Real Effective Exchange Rate (Index)
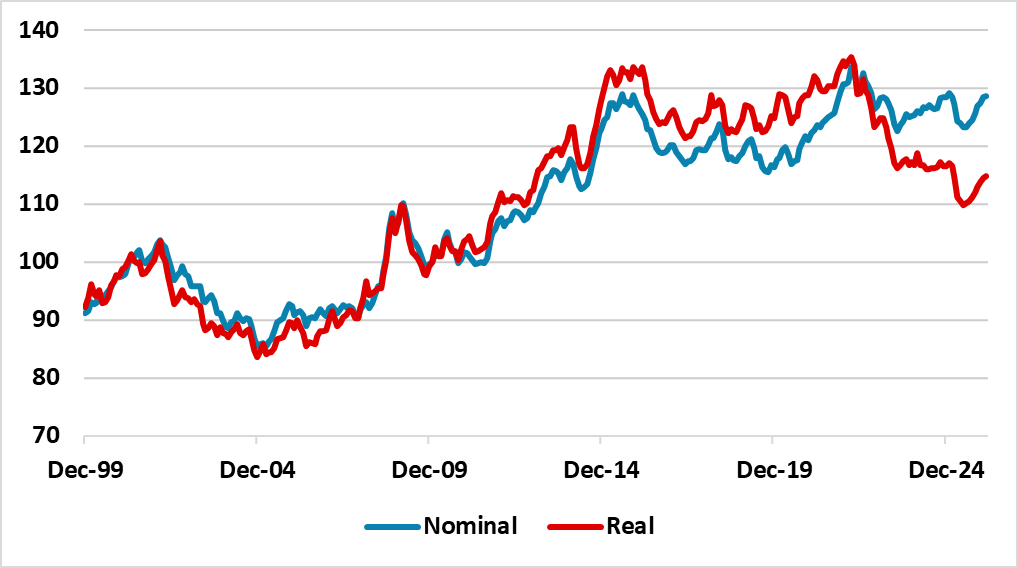
Source: Datastream/Continuum Economics
How much China is willing to allow the Yuan to appreciate against the USD is not currently clear, as the Yuan real depreciation (Figure 2) could allow lots of room. Previously Yuan appreciation has occurred in a stepwise fashion. A 2.5-5% appreciation followed by smoothing FX intervention to allow the Yuan to consolidate followed by further appreciation. Some have also focused on the extra line recently added to President Xi Jinping's 2024 speech that the yuan should be widely used in global trade, investment, FX markets, and more importantly, have the status of a global reserve currency. Some argue that this could mean China authorities are happy to allow a larger and more persistent Yuan appreciation. We are less sure, as this is a long-term multi-year goal rather than for 2026, as capital flow restrictions remain. For the Yuan this all likely means that China is happy to allow Yuan appreciation to 6.80 in 2026, but not 6.40-6.50 that would undermine the competitive edge from the decline in the real Yuan over the last few years. Some further appreciation can be seen in 2027, given a multi-year USD decline against low inflation countries and we see USD/CNY at 6.75 by end 2027.
The Iran War has caused divergent pressures elsewhere in Asia. The India Rupee (INR) has been hurt by India dependence on oil and gas through the Straits of Hormuz. On our baseline of 4-8 week war (here), the INR should stabilise – especially as RBI FX intervention continues to smooth the INR. However, the pre-war goldilocks macro backdrop (controlled inflation and good growth) will take a number of quarters to return and a return of asset flows. India will probably accept stabilisation rather than trying to get a rebound and we forecast USD/INR at 93.50 for end 2026. Even so, the INR has fallen a lot on a real effective exchange rate (REER) basis and India authorities would fight any speculative attack for a bigger INR decline via FX intervention. An RBI rate hike is possible if the war last months and causes a bigger lift to CPI inflation, but not on a 4-8 week war given the RBI dovishness. The Indonesia Rupiah (IDR) has been more impacted by risk off attitude towards Asian assets than the macro impact, as well as concerns that government fiscal consolidation could be weakening. We see scope for IDR to stabilise and potentially bounce to 16800 by end 2026. In contrast, the Malaysian ringgit (MYR) will remain supported by the prospect of still elevated energy prices in 2026, alongside the ongoing AI semiconductor boom. These will likely be enough to limit the reversal of MYR strength and we see USDMYR at 3.95 on USD/MYR by end-2026. Though the MYR REER is at the 2016-26 range, it is still 13% off the post 2008 highs seen in 2013.
LatAm: Rebound Limits?
The Iran war risk off has prompted a partial correction against the USD, after BRL and MXN have seen strong starts to 2026 helped by carry trades. What are the prospects and how much further can this go into 2026?
BRL interest rate differential versus the U.S. will decline, as the BCB has starts an easing cycle and we forecast around 250bps of easing in 2026. However, real yields still remain attractive and with Brazil inflation coming under control, the prospect remains for carry trades to return in H2 2026. Q1 has also seen the election be a tailwind, as Flavio Bolsonaro is tied with Lula in 2nd round polls and this could mean a more market friendly government after the October election. One question being asked is whether the BRL has now overshoot and is overvalued? On some USDBRL fair value estimate it is overvalued, but looking at the BRL REER versus 10yr average (Figure 3) it is still undervalued. Additionally, the pre GFC experience showed extended BRL rallies against the USD in a weak USD environment when wide interest rate differentials existed. We feel that BRL could still appreciate against the USD as long as yields differentials remain wide. Though the U.S. tariff rates on Brazil have now fallen after the switch to section 122 tariffs, the net effect is secondary to the rates, valuation and politics stories.
Figure 3: BRL Real Effective Exchange Rate (Level)
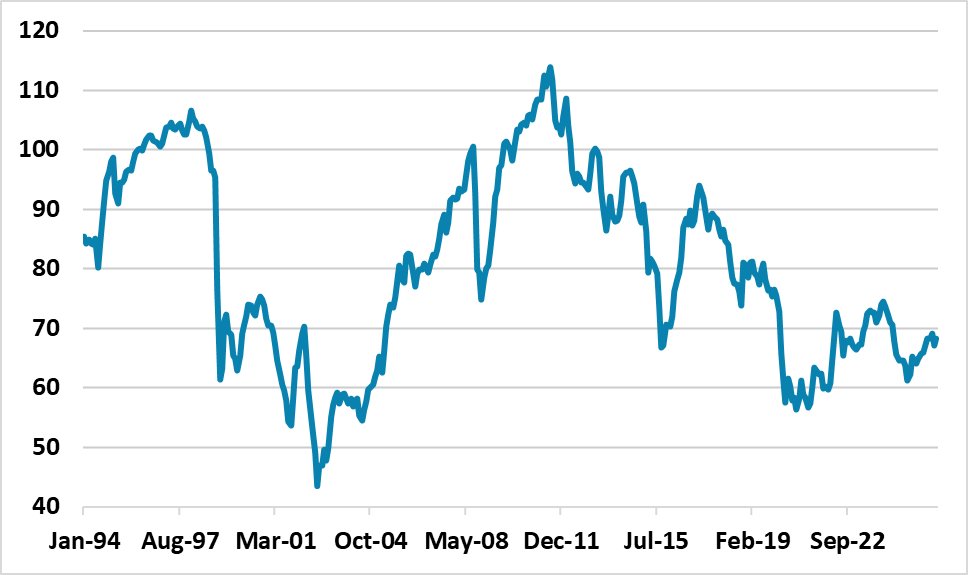
Source: Datastream and Continuum Economics
Even so, pre-election fiscal easing is now an increased risk with close polls and Q2 and Q3 will likely see a BRL consolidation as the political race intensifies. Post-election USDBRL will end 2026 at 5.20 if Lula wins, but 5.00 if Flavio Bolsonaro wins.
2027 will likely see more BCB cuts to 9.50%, but then lower short and long-term yields help reduce government debt servicing and we would also see some fiscal consolidation. This can keep the BRL underpinned and we forecast 5.10 for end 2027.
The MXN has not been impacted by President Donald Trump desire to renegotiate USMCA in 2026, as desires have not yet been followed by threats. However, USTR Greer is clear that Trump wants separate addendums for Mexico and Canada for the USMCA, which suggests that bilateral threats could still increase volatility when negotiations intensify around July 2026. This may mean that MXN recovery is delayed and losses could be seen mid-year. It also worth noting that the MXN has now become overvalued versus 10 and 25yr average on an REER basis (Figure 4). This could bring USDMXN back to 18.00-18.25. Even so, with the Fed and Banxico likely to both cut by 50bps this year, interest rate differentials will still encourage carry trade to return and we see USDMXN at 17.50 by end 2026. MXN will also be supported by the view that U.S./Mexico will agree a renegotiated USMCA successfully by early 2027, which is rightly regarded as a long-term positive – the alternative risk of no renewal and USMCA ending in 2036 is low risk, as Trump eventually wants a deal after his likely theatrics.
Figure 4: MXN Real Effective Exchange Rate (Level)
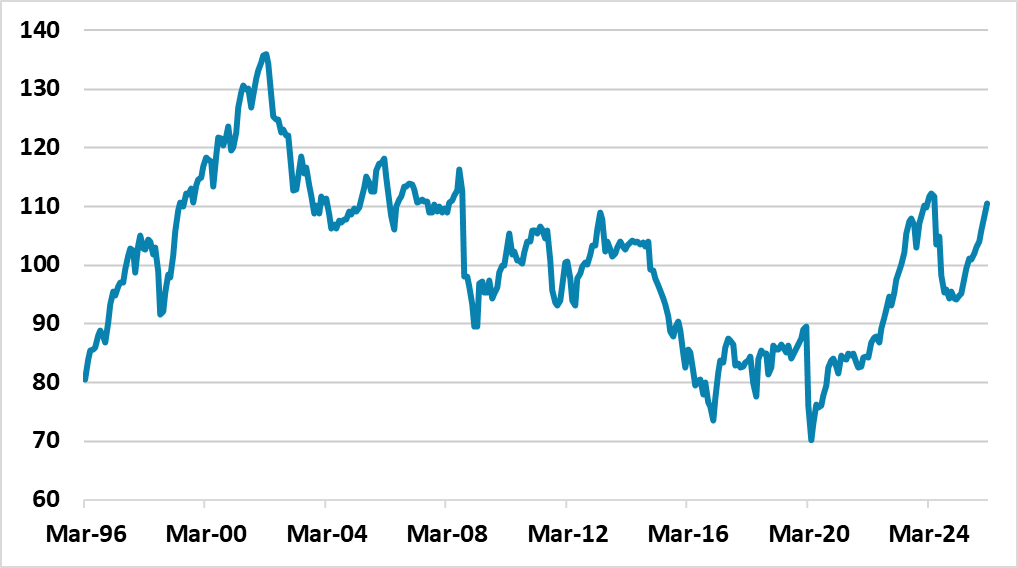
Source: Datastream and Continuum Economics
For 2027, the bottom of U.S. policy rates should start to reduce the benefit of still favorable interest rate differentials for MXN. This can see the MXN slipping to 18.00 on USDMXN by end 2027, given the current MXN overvaluation.
EMEA
EMEA currencies continue to exhibit sharp divergence driven by inflation and interest rate differentials and idiosyncratic risks. When compared with December outlook, the recent conflict in Iran has introduced a new layer of volatility through energy channels and risk-off sentiment.
On our baseline for the Iran war, moderate downward pressure will remain for TRY the rest of 2026 as inflation remains much higher than Turkiye’s main trading partners, the current account deficit is large and foreign capital inflows are weaker-than-expected. Turkey also faces significant lagged risks due to the conflict in Iran, including surging transportation costs, delivery delays, and diminished export competitiveness across multiple sectors. Higher energy prices and logistical disruptions push fertilizer costs up further, increasing production costs for key crops such as wheat, corn and sunflower and potentially feeding into food inflation. These will put downward pressure on the TRY, and we think TRY will still be falling on a spot basis. Our prediction for the USD/TRY rate now stands at 49 by the end of 2026, and 54 for end 2027. (Note: Stubborn inflation could stay above expectations due to sticky food and services prices coupled with secondary impacts of surges in energy prices which would mean more TRY depreciation than our central scenario, likely pushing the rate over 50 for end-2026). Domestic political developments should also be watched, as we look for an early presidential election in September 2027.
Turning to South Africa, ZAR had benefitted from previous gold/metals rally, increasing business confidence, bettering investment environment, no power cuts and removal from the global grey list so far in 2026, before the Iran war prompted profit-taking. However, concerns remain regarding narrowing yield spreads against the U.S. and potential trade tariff rhetoric from the U.S. administration, both of which are compounded by the adverse impacts of the war in Iran. We expect rising production and transportation costs, surges in oil prices, declining export competitiveness will put downward pressure on the ZAR in Q2/Q3. SARB will halt its easing cycle, while we expect a cautious and data-dependent SARB will likely try to bring inflation down to new 3% anchor (we forecast inflation is set to move to 4% in Q2/Q3). Under current circumstances, our end year USD/ZAR rate prediction stand at 17.5 for 2026, and 17.7 for 2027.
Although, not our primary in-house scenario, we think a 2-6 month conflict (here) in Iran would likely trigger stagflationary shocks for EM countries as surging energy costs would put pressure on the current account balances and also weakening capital flow, as well as boosting inflation more than our baseline forecasts. This could particularly put extra downward pressure on the ZAR and TRY. With oil prices potentially surging toward USD 120–180, EM central banks might be forced to cancel planned interest rate cuts or, in some cases, implement modest rate hikes to counteract second-round inflationary effects. EM central banks will likely want to avoid rate hikes if the war is 4-8 weeks, which remains our main scenario.
Elsewhere, we envisage RUB would remain volatile the rest of 2026. Despite moderate easing, inflation differentials against the U.S. remain wide, and the Central Bank of Russia (CBR) struggles with a sticky inflationary environment that is not cooling as fast as CBR expects since foreign capital inflows remaining weak until sanctions are lifted and global investor confidence in Russia rebuilds. We assess macroeconomic instability will remain substantial unless the Ukraine war comes to an end. (Note: Our baseline scenario in Ukraine is the war dragging on throughout 2026 (70%) and the alternative is a Russia friendly peace deal (30%)). RUB will still be falling on a spot basis in 2026, and our end-year USD/RUB rate predictions are at 88 and 91 for 2026 and 2027, respectively. We think high domestic gas and oil production will curtail domestic energy prices in contrast to global energy prices while higher global oil prices in Q2/Q3 and temporary sanctions relief due to the Iran conflict could boost Russia crude exports and help relieve fiscal pressures. (Note: Higher energy revenues may facilitate expanded military spending, potentially triggering demand-pull inflation. Conversely, they could moderately decelerate inflation via the FX channel, although the impact of sanctions would likely limit this effect. We expect the net result to be a secondary rather than a dominant factor on RUB).
Figure 5: USD/ZAR Rate and 10yr South Africa-U.S. Government Bond Yield (%)
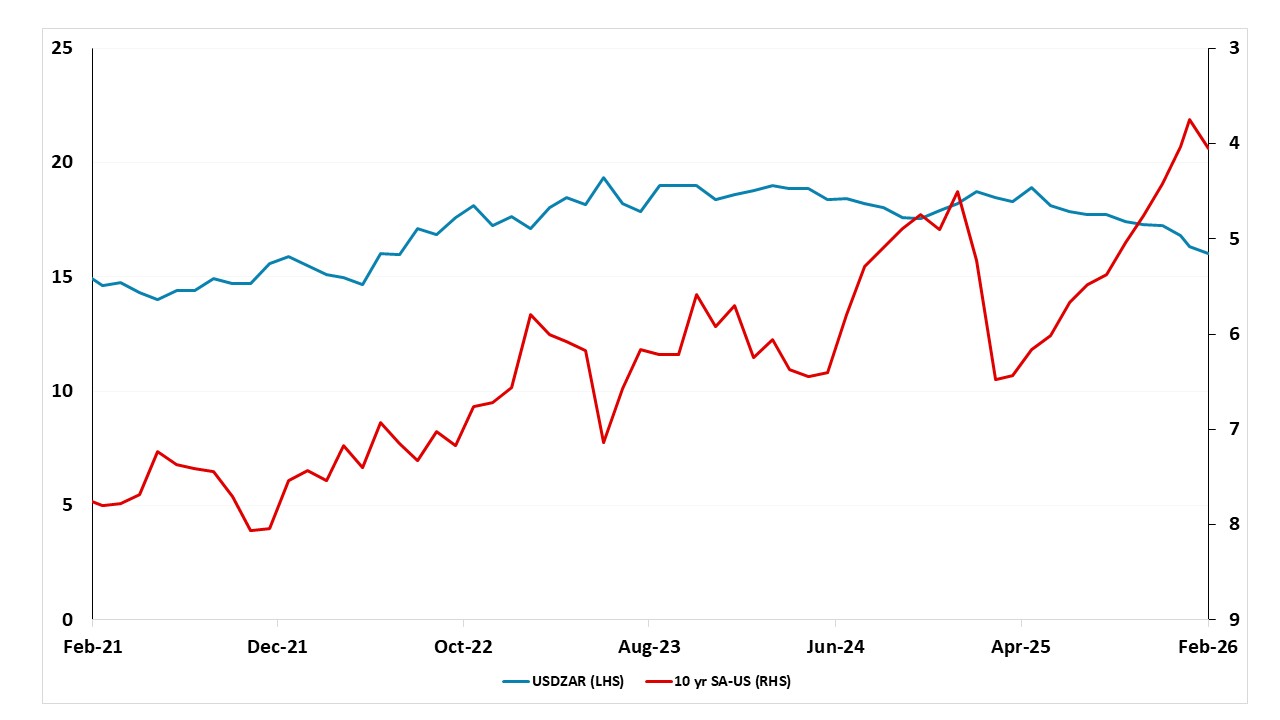
Source: DataStream/Continuum Economics