Commodities Outlook: Economic Forces at Play
• Oil prices in 2024 hinge on OPEC's production policies and global economic growth. We expect the agreed-upon 2.2 million bpd voluntary cuts to be implemented in Q1 2024, most of them extending into Q2 due to weak global growth. With Saudi Arabia supporting the cuts, we assign a 60% likelihood that at least some of the cuts will continue into H2 2024, although tensions within OPEC may impact further agreements. Additionally, China's slowing oil demand growth, coupled with weak economic growth in the U.S. and Eurozone, contributes to our forecast of WTI at $84 by the end of 2024.
• In 2024, two key factors will influence gold prices. Firstly, central bank demand, particularly from the PBOC, is crucial. China's increased gold demand aims to reduce reliance on the USD, mitigating vulnerability to potential U.S. sanctions amid geopolitical tensions. Secondly, a weaker USD and a projected 3.8% 10yr U.S. yield by end-2024, following the projected Fed’s monetary easing, will support gold investment. We predict gold at $2,100 by end-2024 and $1,950 by end-2025.
• Despite the marginal upward adjustment in our China's GDP growth for next year, we are maintaining our copper forecast at $8,700 by the end of 2024. This decision is influenced by our consideration of potential supply pressures arising from mines in Latin America.
• Risk to our views: From a supply standpoint, a more aggressive policy from OPEC could send WTI prices above $90. In the copper sector, continued supply disruptions coupled with low inventories could put at risk the expected surplus in 2024. Lastly, the risk of a prolonged recession in the EZ/UK and a mild recession in the U.S. would naturally hurt demand for commodities.
• Oil: Production Cuts and Demand Dynamics
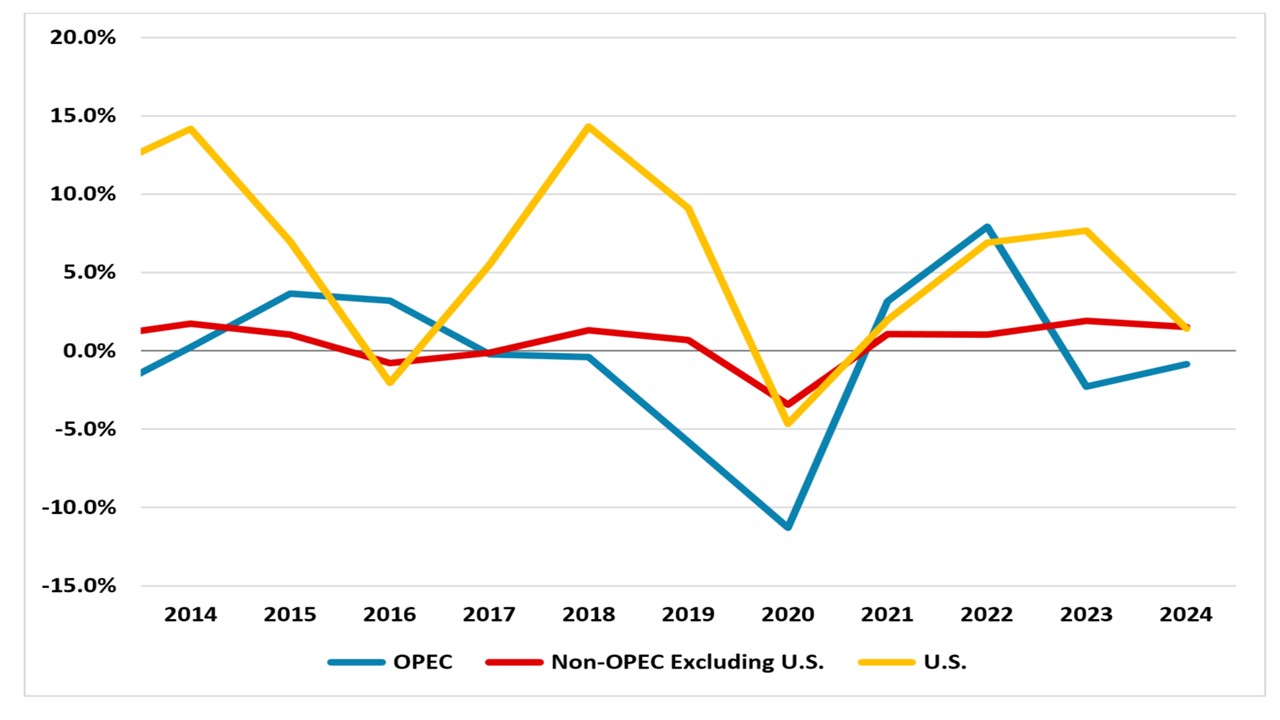
The trajectory of oil prices will be significantly shaped by both the production policies to be adopted by OPEC and the global economic growth. In light of the voluntary cuts agreed upon by several countries within the cartel during the November 2023 OPEC meeting, and despite traders' skepticism about whether these cuts will actually be carried out, we believe that these cuts, amounting to about 2.2 million bpd, will be implemented during the first quarter of 2024. Indeed, amid weak global economic growth, we further anticipate that most of these cuts will be extended into the second quarter of 2024, at least those cuts from Saudi Arabia and Russia’s exports curbs. The crucial question then emerges about the cartel's interest and its ability to reach an agreement to extend or deepen these cuts into the second half of 2024. The November meeting underscored certain weaknesses within the cartel, with Angola and Nigeria refusing to agree to production quotas and the communication of cuts occurring individually rather than through a joint agreement. However, Saudi Arabia, actively supporting the cuts to manage its budget could continue holding the position to maintain the cuts. Additionally, while U.S. production growth is expected to slow compared to 2023, other non-OPEC countries will continue their production rates (Figure 1), putting pressure on OPEC members. In balance, we assign a 60% probability for at least some production cuts to roll over into the second half of 2024.
Oil demand is the second factor which will shape oil’s price direction. In China we expect a slowdown in oil consumption growth. Moreover, consistent with our forecasts for the country’s economic growth for 2024 and 2025, the effects in the pent-up in demand after COVID will start fading away next year, impacting consumption and travel spending. The U.S. and the Eurozone will experience weak economic growth, in particular during the first three quarters of 2024, with some signs of recovery by the end of the year; thus, demand for oil will also remain weak in these regions. It is noteworthy, however, that the U.S. plans to purchase up to 3 million barrels of oil for the Strategic Petroleum Reserve, aiming to replenish inventories.
Overall, we see WTI at $84 per barrel by the end of 2024. Looking ahead to 2025, our baseline case, taking into account OPEC policy, assumes the elimination of voluntary cuts by the year's end. This scenario coupled with growing supply from non-OPEC countries and the absence of an exceptional economic growth in large economies to significantly boost oil demand lead us to project WTI at $77 by end-2025.
Figure 1: Petroleum Production YoY Growth

Source: Continuum Economics / EIA
Copper: China’s Green Transition Supports Demand
China’s copper consumption continues to be the main driver of the commodity’s price. In this context, we anticipate that various factors influencing the demand in the Asian country throughout 2023 will persist in a similar direction in 2024. Notably, the demand for copper in China, propelled by electric vehicles and installed solar capacity, is expected to persist next year. For instance, the China Passenger Association (CPCA) forecasts electric passenger car sales to reach 11 million units in 2024, reflecting a 22% increase from 2023. Similarly, China’s energy bureau reported a 47% growth in total installed solar power capacity in October compared to the previous year. Despite these encouraging indicators, concerns about the country’s economic growth, particularly in the property sector, may partially curb the growth in demand. Our perspective is that, in spite of the various measures implemented by the government, the property sector will continue to face constraints, while overall growth is projected at 4.2% for China in 2024. On the upside, however, the global start of the monetary easing cycle accompanied with a weaker USD would be factors that can give some support to prices. We believe that the real global pent-up in demand as countries transition towards electrification and clean energy will likely start in the second half of the decade.
The supply outlook for copper remains healthy, with the International Copper Study Group (ICSG) suggesting that mine capacity is set to increase by an average of 3.4% per year for the period 2023-2027. However, the market's sentiment has begun to consider recent developments, particularly in Latin America, which have underscored how, despite a potential slowdown in copper demand given the weak global economic growth, production shocks can impact the market given the historically low levels of inventories. The most recent and significant shock involves the Panamanian government's order to First Quantum Minerals to cease all operations at its copper mine, accounting for approximately 1.5% of the total global supply. Operational issues also persist as a threat in certain copper mines. For instance, Codelco (largest global copper mining company) estimates its 2023 copper output at 1.31 million tons – at the lower end of its projected range – due to these operational challenges. The firm, however, contends that production could start to recover next year, reaching 1.34 million tons. In Peru, workers continue to strike, demanding a greater distribution of profits – a situation that could bolster the ICSG's perspective on the Democratic Republic of Congo becoming the second-largest copper producer, surpassing the South American country.
In our assessment, we anticipate copper reaching $8,700 per ton by the end of 2024. Looking ahead to 2025, with the global economy displaying more signs of recovery and the global supply maintaining a robust growth trajectory without revealing vulnerabilities from underinvestment until the latter part of the 2020s, we project that copper will reach $9,000 per ton by the end of 2025.
Gold: At All-time Highs
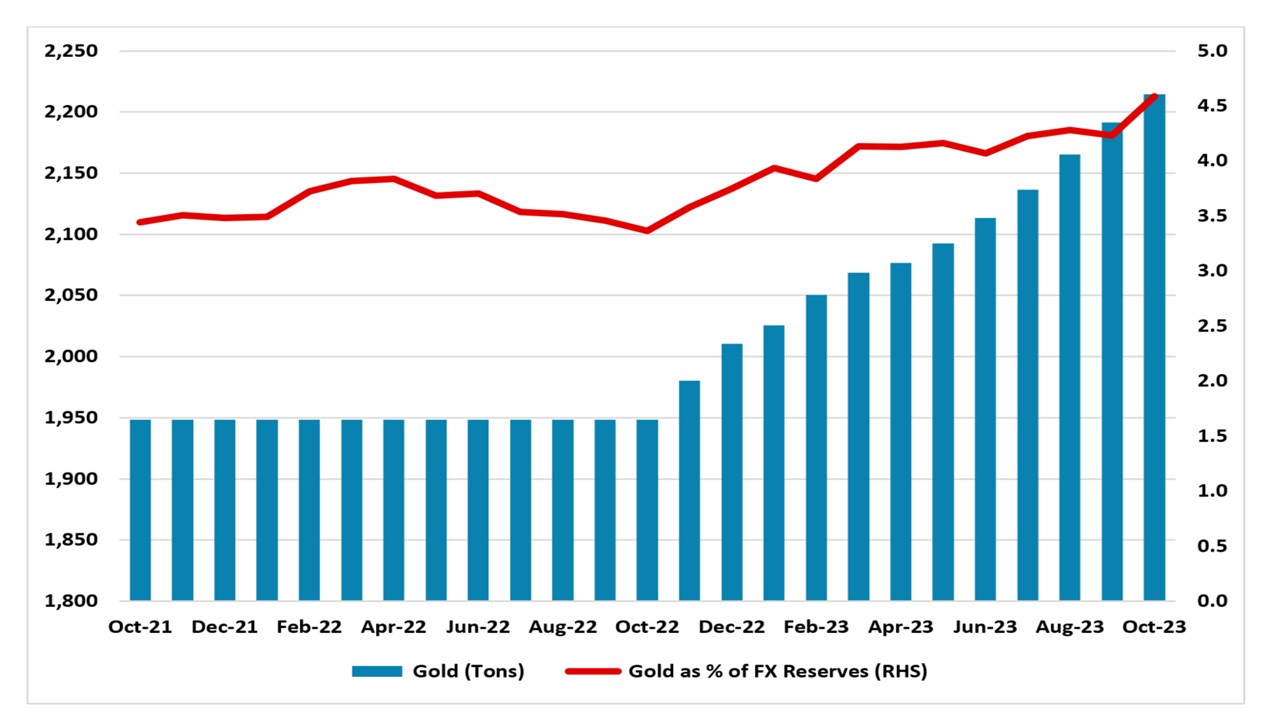
Two factors will be the key drivers of gold prices next year. First is the demand from central banks, pivotal to supporting gold prices; in this regard, the role of the PBOC will remain relevant as the country has increased its demand for gold (Figure 2), positioning itself as the leading central bank buyer over the past two years. We believe the PBOC will likely continue with this trend in 2024 as it looks to reduce its reliance on the USD, mitigating its vulnerability to potential sanctions from the U.S. amid potential geopolitical tensions. The second factor is a weaker USD and our projection for 10yr U.S. yields, which we expect to reach 3.8% by the end of 2024, following a downward trend after the Fed starts a monetary policy easing cycle. The inflow of ETF funds, driven by investors anticipating the start of a new cycle, would further ramp up demand for gold.
The global economic slowdown and geopolitical developments could also impact gold’s price, albeit to a lesser extent. Lower consumer spending would affect sales in the technology and jewelry sectors amid the weak economic growth we foresee, and an increase in gold prices would also dampen demand in the consumer sector. Additionally, while not our baseline scenario, increased geopolitical tensions, including but not limited to the conflicts Israel-Hamas, Russia-Ukraine, and China-Taiwan, could push up the commodity’s price – as it happened when the first of these conflicts started in October of 2023. Gold supply is expected to remain robust during 2024 and 2025 and we believe demand factors will dominate supply forces in determining gold prices. The latest data from the World Gold Council shows an all-time H1 high in mine production during 2023, driven by increases in output in South Africa, Ghana, and Russia.
As a result of the interactions between the variables considered in our analysis, we forecast gold to hit $2,100 by end-2024. Turning our attention to 2025, a crucial question arises concerning the duration of gold purchases by the PBOC and other central banks. We anticipate that this trend may have disappeared by the end of 2025. Furthermore, the deceleration in the pace of the Fed’s monetary policy easing is projected, leading to investment outflows. Conversely, a more robust economic growth compared to 2024 could stimulate demand within the consumer sector. However, recognizing the overriding significance of the first two factors, we anticipate gold to be at $1,950 by the end of 2025.
Figure 2: PBOC’s Gold Reserves Evolution
Source: Continuum Economics / PBOC
