U.S. Debt Divergence
Household debt/GDP has fallen noticeably since the GFC to largely counterbalance the rise in government debt/GDP. However, a surge in household borrowing for consumption with Fed easing is unlikely, as the overall resilience on consumption hides buoyance among wealthy households and a struggle/low consumer confidence among low to mid income households.
While U.S. Government debt/GDP has increased steadily since the GFC, Household debt/GDP has fallen. What does this mean for overall debt and the U.S. economy?
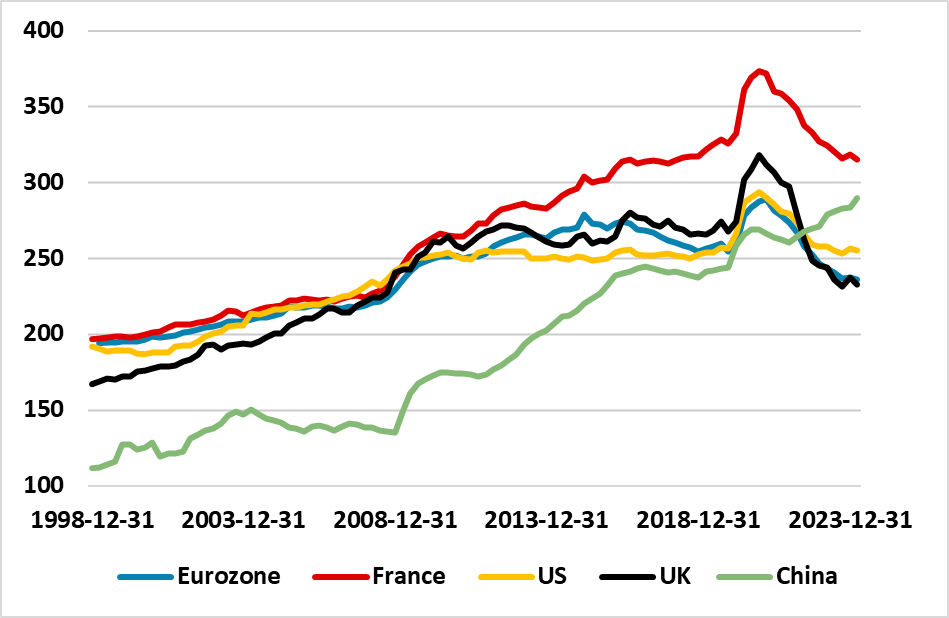
Figure 1: Total Government/Household and Corporate Debt/GDP (%)

Source: BIS/Continuum Economics
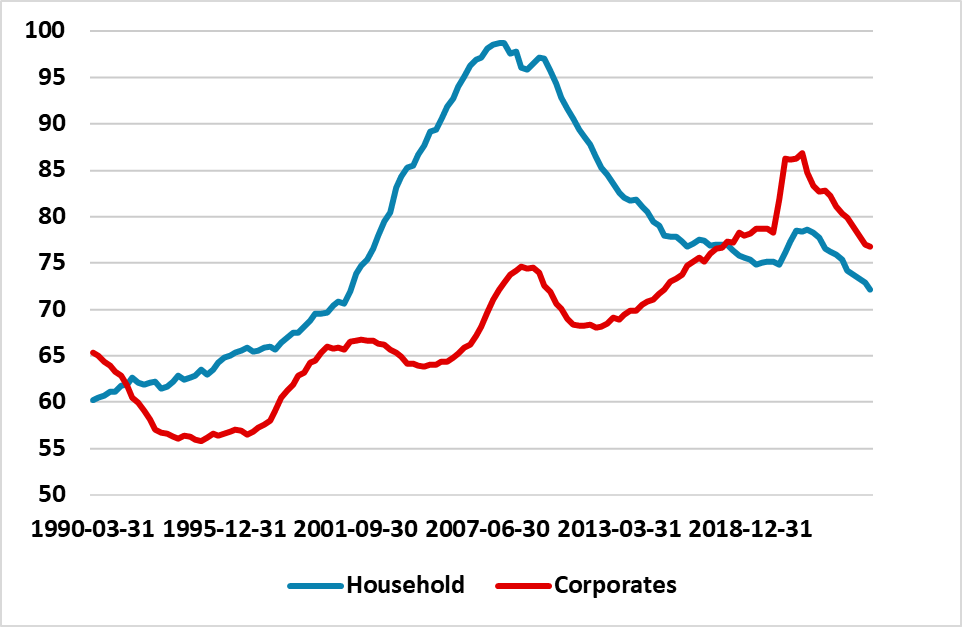
Though U.S. government debt/GDP has risen consistently since the GFC, overall government/household and corporate debt to GDP is little changed compared to 2008 (Figure 1). The reason is that household/debt to GDP has fallen consistently, while corporate debt/GDP is barely higher than 2008 (Figure 2). The household debt/GDP trend reflect three issues. Post GFC households decided to deleverage after the twin bust to housing and equity wealth, which was then followed by the secular bull market in equities and recovering in the housing market that prompted a surge in wealth and less need for household borrowing to keep pace with nominal GDP. Finally, the surge in nominal GDP since 2022 has been unusual compared to the normal experience of 3-5% nominal GDP growth and surpassed household debt growth.
Figure 2: U.S. Household and Corporate Debt/GDP (%)

Source: BIS/Continuum Economics
The total non-financial sector debt, combined with the USD reserve status and still large Fed holdings, means that we are not acutely concerned by the U.S. government debt/GDP level at this juncture – though a post-election concern would be a worry. We are concerned about the U.S. government deficit/GDP level however (here), as we are starting at 6% of GDP and the vast majority of election outcomes are unlikely to be followed by fiscal consolidation. We see this causing heavy issuance and keeping U.S. real long-term rates elevated.
What does the contrasting trajectory for government and household/corporate debt mean for the U.S. economy? For U.S. corporates, the current level of corporate debt/GDP is not an overall constraint to business investment, while a lot of large corporates locked in ultra-low interest rates and will only have to adjust to the new normal level of interest rates in coming years. Nevertheless, small and medium sized corporates have less financial resilience and this means the outlook for Fed easing/economy/inflation and broader policy setting remain key after the election.
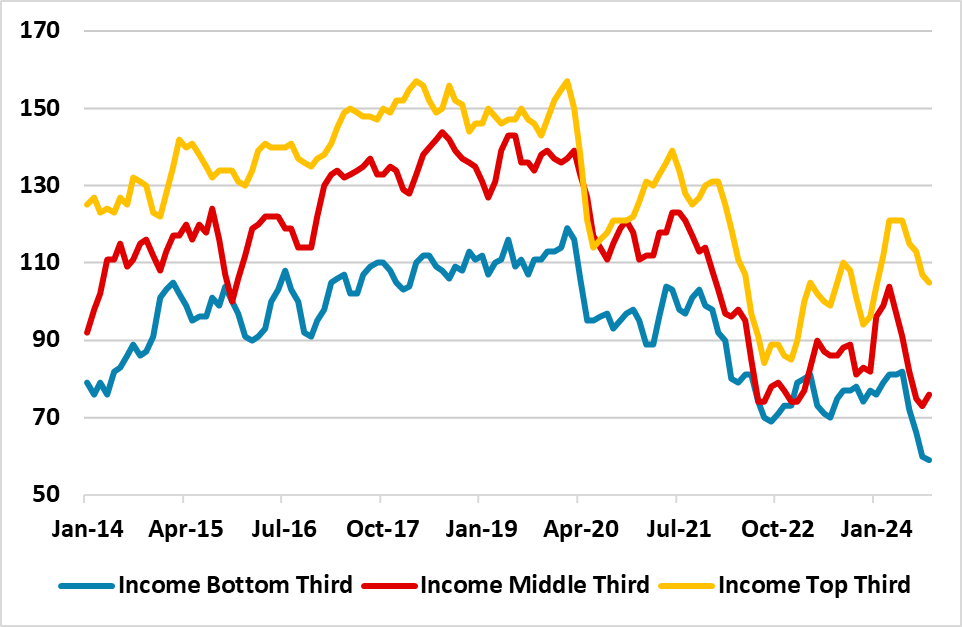
The household sector at face value has scope to increase borrowing faster than GDP with household debt/GDP at 2001 levels (Figure 2). However, the U.S. household situation is divergent. Fed studies show that wealth is concentrated in the top 10% and the bottom 25% have limited wealth (here). Wealthy households are enjoy a booming stock market and rebound in home prices in sharp contrast to 2008-10. This has seen an acceleration of spending among high income groups. In contrast low income groups in the U.S. are suffering as they have less net wealth and are more dependent on income/employment. With the price of essentials having surged since 2022, the lowest 1/3 of households have a bleak outlook on the current financial situation according to University of Michigan data (Figure 3). Credit card and auto delinquency loans default rates have also crept up as well, with the NY Fed seeing the latter among lower income groups (here). Employment growth remains the critical issue post-election, but the resilience of consumption hides some divergence underneath and a surge in borrowing to finance consumption is unlikely.
Figure 3: Current Financial Situation Compared to One Year Ago (Better-Minus Worse Plus 100)

Source: UoM/Continuum Economics