UK Household Wealth and the Pension Predicament
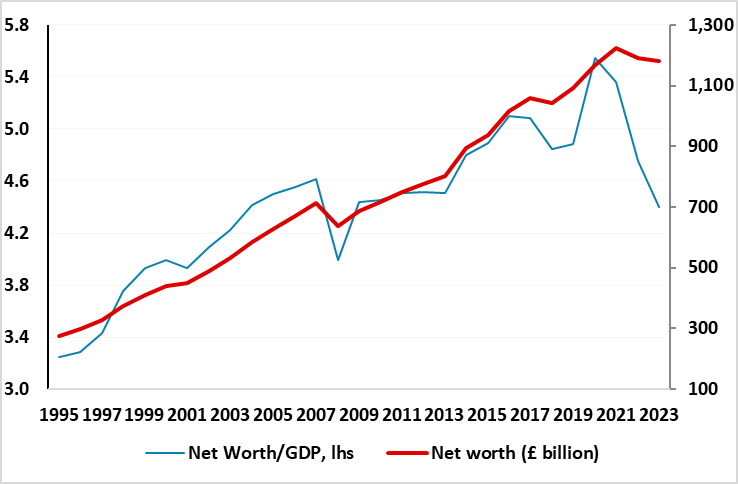
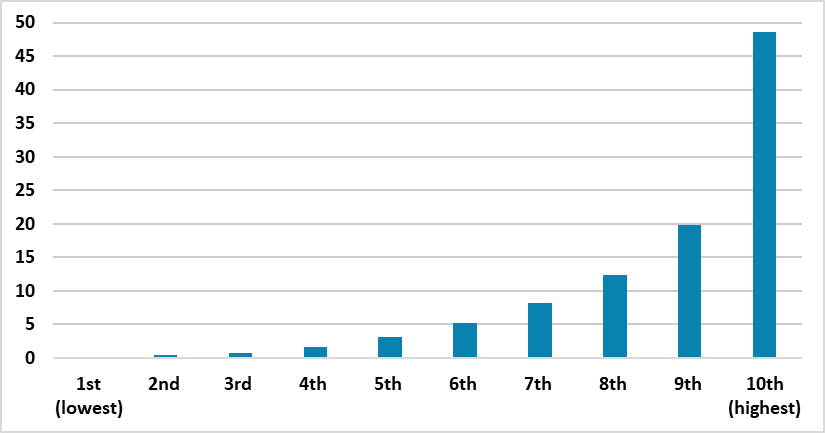
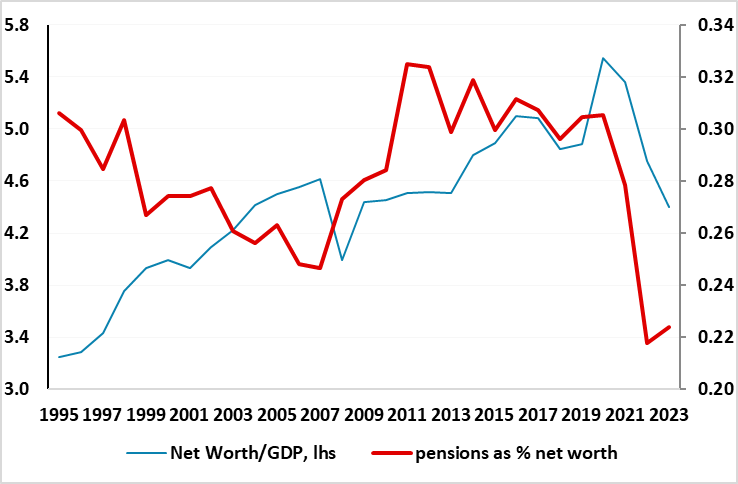
Unlike some other parts of the DM world, UK households have seen a serious dent put into their stock of wealth in the last two years. Indeed, household net worth fell in both 2022 and 2023, both in absolute terms and also as a % GDP (Figure 1). The 2022 drop was very much a slump in pension fund assets as the BoE rate hiking cycle hit government bond prices. It was also a result of a fall back in household savings, after the pandemic induced surge on the previous year or so. The drop in 2023 was more housing market related. But with bond and house prices now on the mend and household saving more, net worth is likely to recover this year. This will have little bearing on most UK households as half of households hold around only 6% of all wealth (Figure 2). They also are more likely to be renting and thus while shielded from higher mortgage rates, but instead are thus exposed to record rental inflation. As for richer households they may benefit from recovering house prices albeit where the link between the latter and consumer spending is far from significant. But the question is whether the unprecedented slump in pension assets (Figure 3) will have any medium-term impacts not just on spending, but even on the supply of labor.
Figure 1: Household Net Worth Slumped

Source: ONS
Inequality Quantified?
As in all DM countries, wealth in the UK is unevenly distributed, with the richest 10% estimated to hold around half of all wealth, primarily in the form of private pensions and property. In contrast, and as Figure 2 shows, the lower half of the population holds just 6% of all assets. The disparity is regional too with the richest part of the country (the south-east) some three times wealthier than the poorest (north east). Property ownership and property value explains most of the difference in average wealth between these regions. Despite the south east having the highest house prices outside London, those living there are among the most likely to own property (64%). By contrast, those in poorer regions, most notably the North East, were the most likely to live in rented accommodation.
Figure 2: Household Wealth Disparities

Source: ONS, decile is one of ten equal groups into which a population can be divided
This may seem to insulate these poorer households from the impact of the jump in mortgage rates, but of course they will be more exposed to higher borrowing costs needed to supplement income from either employment or welfare – NB consumer credit growth is running at well over 11%. This may seem puzzling against the backdrop of rising household savings rates, but probably is explained by the obvious that those saving are not those who are borrowing. But in addition, these poorer household, who are dependent on either employment income and/or welfare handouts will also be more exposed to higher rents have risen – now a record rates of over 8% as well as the drop in employment that seems to be emerging.
Otherwise, wealth prospects are also very much driven by individual's education and the way they make a living, with positive correlations between wealth and degree-level qualifications, higher socioeconomic class occupations and public sector employment.
The Pension Plunge
On average, individual wealth increases with age, peaking in the 60-to-64 age group at a level nine times as high as the 30-to-34 age group, before falling in older age groups as people use their wealth to support life and spending power in retirement. This reflects the fact that households typically accumulate wealth gradually over the course of their working life, building savings, paying into pension schemes and buying property, before using this wealth to support their life in retirement and often passing it on to younger generations (the so-called life-cycle hypothesis). But wealth even for these relatively richer people has been damaged markedly of late by the large fall in outstanding pensions which in 2021 accounted t for 60% of net financial wealth and nearly 30% of total net worth.
Figure 3: Pension Wealth Slump

Source: ONS
Some of this reflects people drawing on the pensions early, ie before normal retirement age, but also by the fact that much of the overall pension pot is parked in government bonds – this partly the so-called “lifestyling” approach by pension providers that gradually switches company pension savers out of shares and into bonds, usually between the ages of 55 and 65. But the combination of the surge in inflation, the ensuing anticipation of BoE hiking by the gilt market and the Truss budget fiasco (2 year gilt yields rose 390 bp though 2022) saw a huge drop in pension assets in 2022 that has yet to be anything like repaired (Figure 3). NB: some two decades ago, almost two thirds of all gilts were owned by pension schemes and insurers but that has fallen now to below a quarter, partly a result of QE. Overall in 2022 the nominal value of all UK pension assets in the national accounts fell by around 25% or £760 bn.
Regardless, this pension effect may explain the fall in the amount of people having retired early. Indeed, those between 50 and 64 who were active in the workforce rose clearly from early 2022, but has starred to fall back this year, possibly a result of long-term health issues. Nonetheless, there has been a clear rise in those over 65 a who are active in the workforce. These are important issues in understanding what has been a drop in overall participation since the pandemic, this juxtaposed by a recovery in average hours worked.
Pension worries (actual and realised) may also explain the marked jump back up in household savings rates in the last few quarters. Notably, the savings rate rose three ppt to 11.3% of disposable income in the year to Q1, something that helped prompt the marked upward revisions to the savings rate outlook assumption of the BoE in its last Monetary Policy Report. Admittedly, this rise in savings has potential positive implications for consumer spending, not least as rates are now some three ppt above pre-pandemic averages and of course are the most liquid of household assets. But time will tell whether households are building precautionary savings against a backdrop of depleted pension assets.
Notably there is no clear correlation between swings in pension assets vales and consumer spending, but the drop in the former through 2022 was unprecedented in size and thus it is hard to fathom. Possibly a recovery in house prices may help as may a better equity picture in repairing the damage to household net wealth seen in the last two years (Figure 1). But our worry is that households may actually have felt a double whammy in how swings in various prices have affected their spending power recently – a huge jump in the level of consumer prices and rents alongside and accentuated by a marked fall in asset values both housing and financial. Hence our still below consensus consumer and GDP outlook for the UK into 2025.