U.S. Household Wealth: Bottom 50% Need Income
Beneath the surface Federal Reserve data shows that the bottom 50% of households have little net wealth and they depend on employment income and government handouts. With excess post COVID government handouts having been largely exhausted, lower income households are starting to suffer from slowing employment growth and higher interest rates. This is all part of our soft landing story, but a sharper slowing in employment growth could cause more acute problems in the bottom 50% of U.S. households.
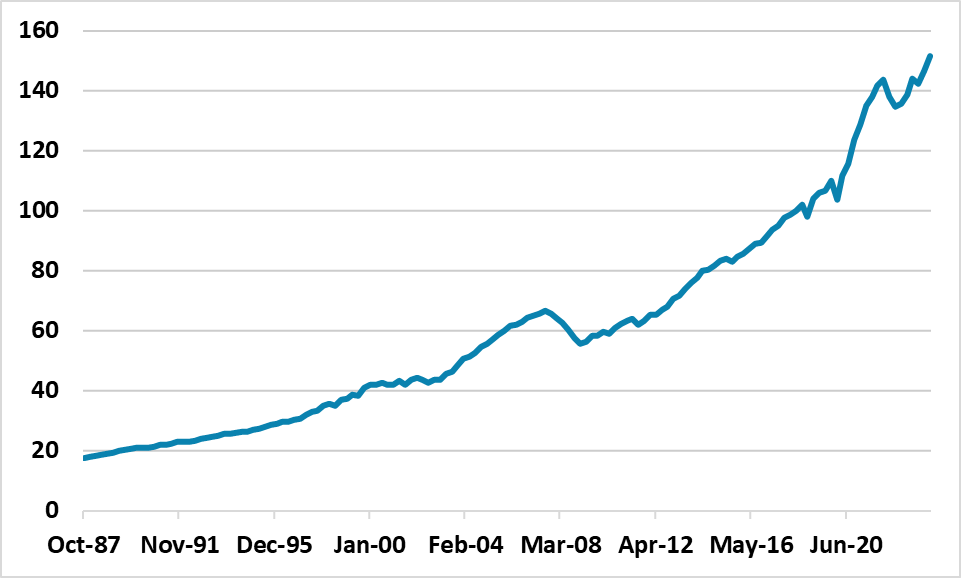
U.S. Household Net Wealth has surged since the GFC (Figure 1), what are the trends and what does it mean for consumption.
Figure 1: U.S. Household Net Worth Surges (USD Trns)

Source FRED
U.S. Household net wealth has surged from USD56trn in Q1 2009 to USD152trn by Q1 2024, for three reasons. Firstly, U.S. Households decided to pay down debt in the aftermath of the GFC, after a surge in the prior two decades. Secondly, population growth but subdued housing starts helped to boost house prices through the 2010’s, with the 2020 pandemic causing an increase in housing demand with work from home. Thirdly, the rally in the U.S. equity market from the 2009 lows has been substantive, helped by the recovery in the U.S. economy but also U.S. exceptionalism – especially in the technology sector.
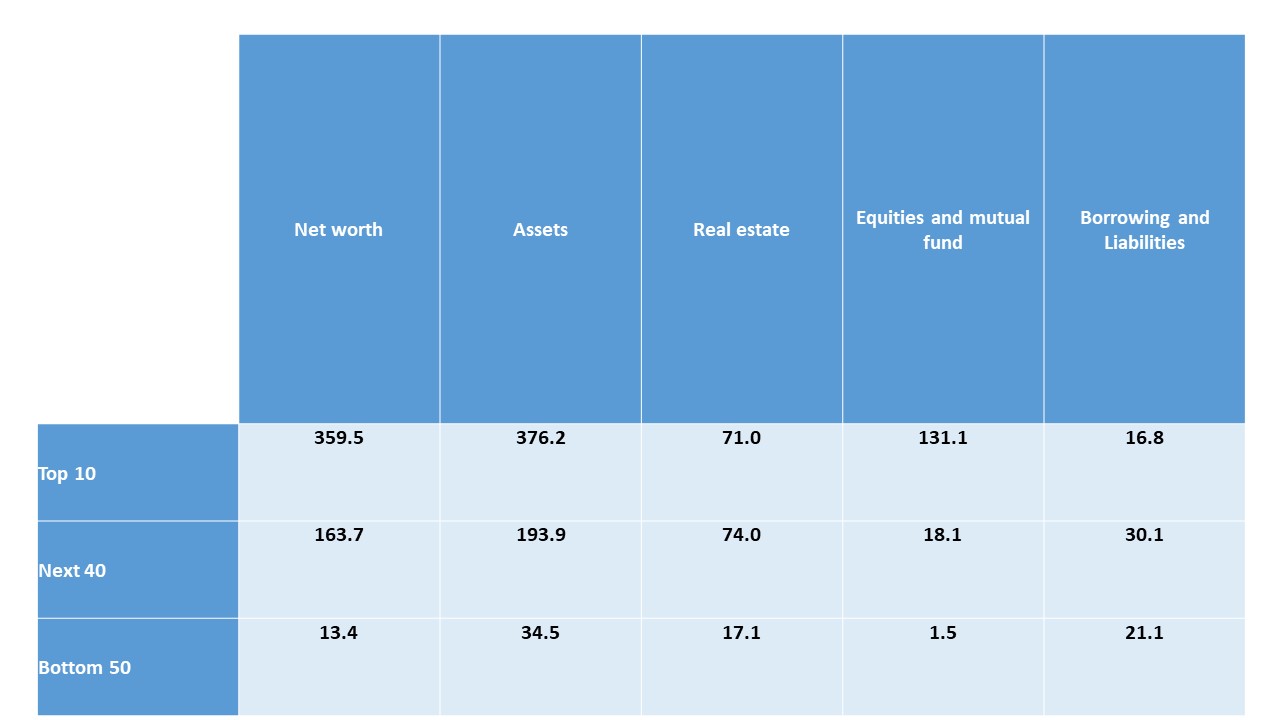
However, this surge in wealth has been uneven, as the top 10% of the population have disproportionately large holdings of equities and mutual funds, but also private businesses and other assets according to Federal Reserve data (Figure 1). The top 10% hold 67% of household net wealth. The next 40% of the population have real estate wealth, alongside pensions/other assets and fourthly equities/mutual funds. The bottom 50% have little net wealth as borrowing counteracts real estate wealth. They have 2.4% of overall household net wealth. The top 10% have benefitted from higher equity and house prices, but the bottom 50% have seen little net benefit. Beneath the surface this is a problem for the U.S. economy.
Figure 2: Top 10% and Bottom 50% Huge Divergence in Wealth (% Nominal GDP Q1 2024)

Source Federal Reserve
The bottom 50% of households depend on real income growth after tax and continued employment. Real income growth is slowing but still positive, but employment growth is slowing. This is an issue if soft landing turns into harder landing, that produces much slower employment growth and/or increase in job losses that in turn causes rising uncertainty among low income households about their continued employment. The post COVID government payments have masked this underlying problem, but these excess savings appear to have been largely exhausted.
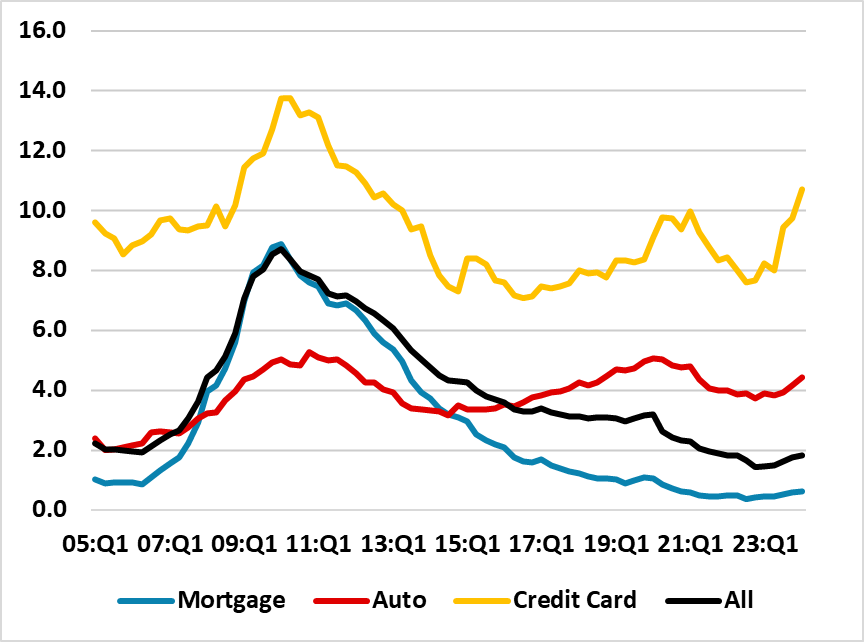
Recent credit card delinquency data shows a noticeable surge (Figure 3), while company results are starting to note that revenue and profit growth is being impacted by the financial pressures on low income U.S. households. Mortgages locked in the low interest rate post GFC, but other consumer loans are now seeing the impact of a move to restrictive Fed policy.
Figure 3: 90 day plus Delinquency Rates (% of loans)

Source: New York Fed Consumer Credit Panel/Equifax
Overall, the difficulties for low income is part of our soft landing story for the U.S. economy, but still needs to be watched carefully as dependence on employment income in the bottom 50% of U.S. households is an issue.