U.S. Q4 GDP Led by Strong Consumer Spending
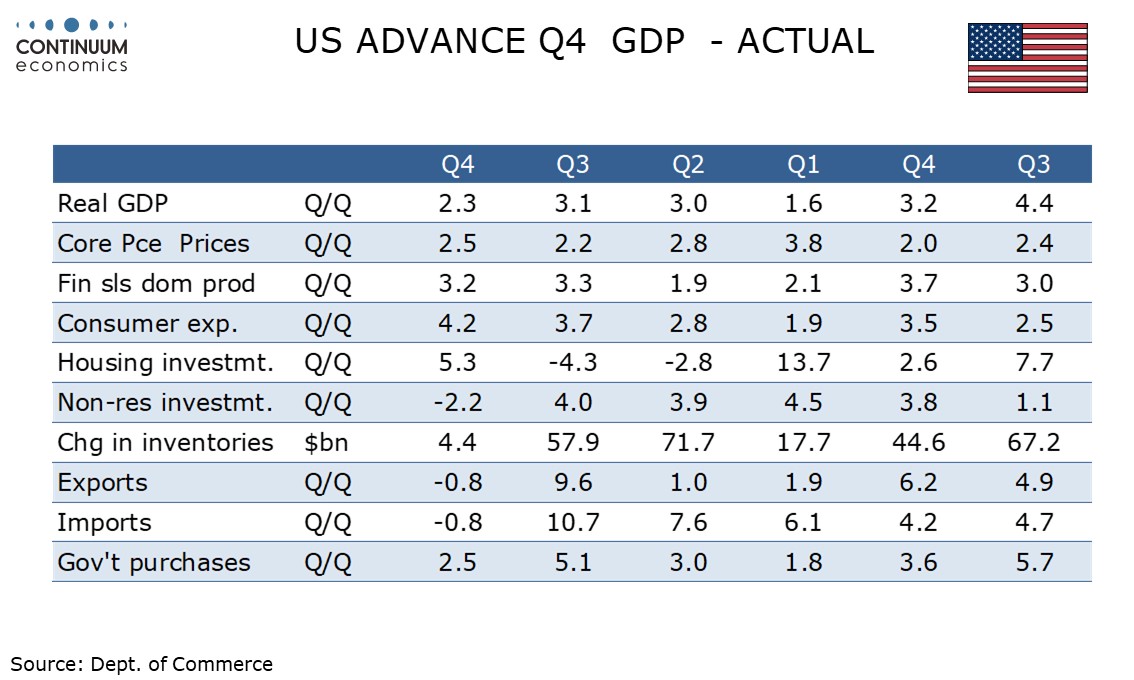
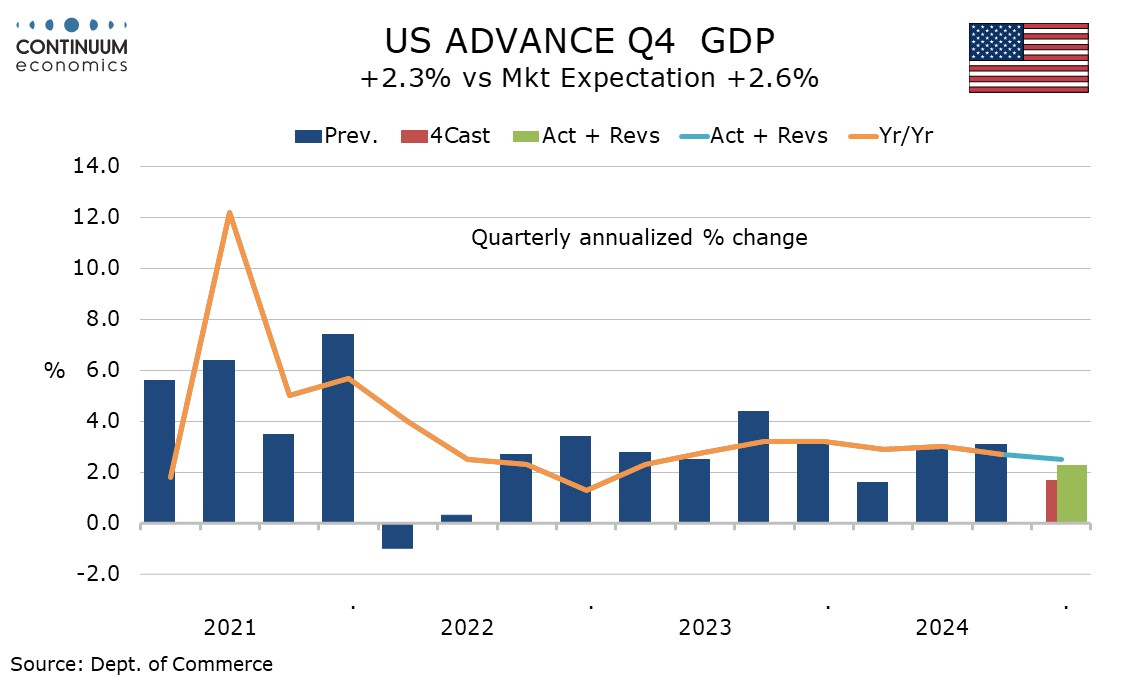
The 2.3% increase in Q4 GDP is little weaker than consensus expectations surveyed before yesterday’s weak trade and inventories data but the data was supported by a significantly stronger than expected 4.2% rise in consumer spending, keeping the pace of growth solid. Core PCE prices at 2.5% are on consensus, showing inflationary pressures moderately above target.
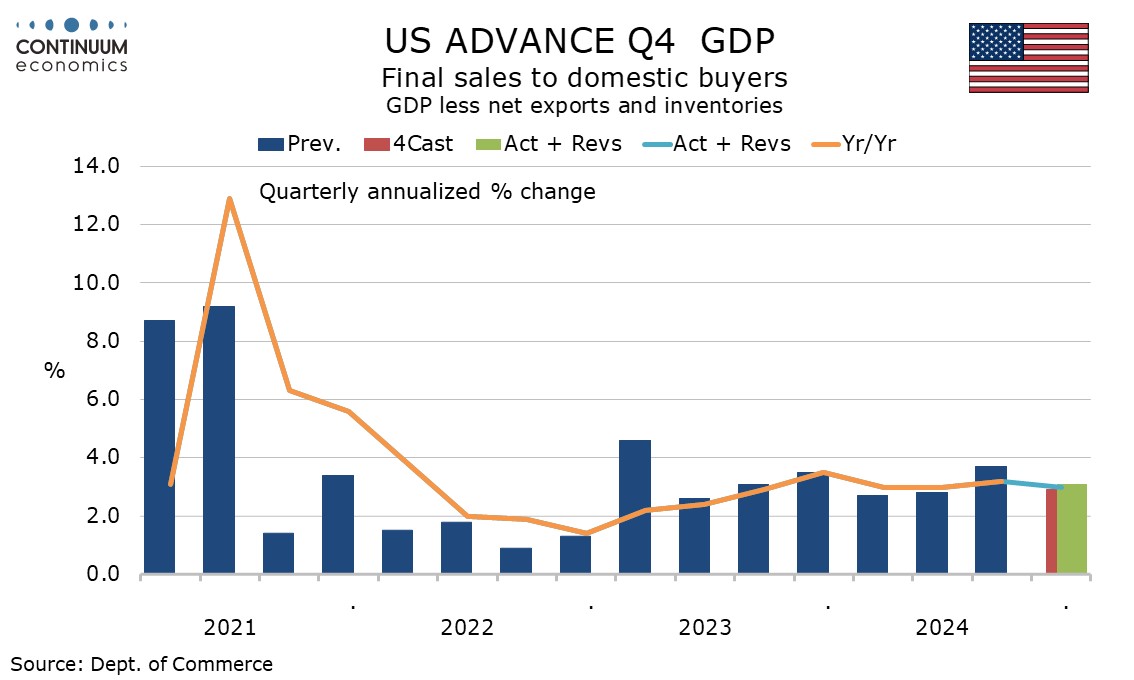
Final sales rose by 3.2%, meaning a negative of 0.9% from inventories, and weak inventory growth in Q4 provides potential for a bounce in Q1. Final sales to domestic buyers rise by 3.1%, meaning net exports actually contributed marginally positively to GDP by 0.1% with exports and imports both falling by 0.8%. Both series were restrained in October by a strike at northeast ports.
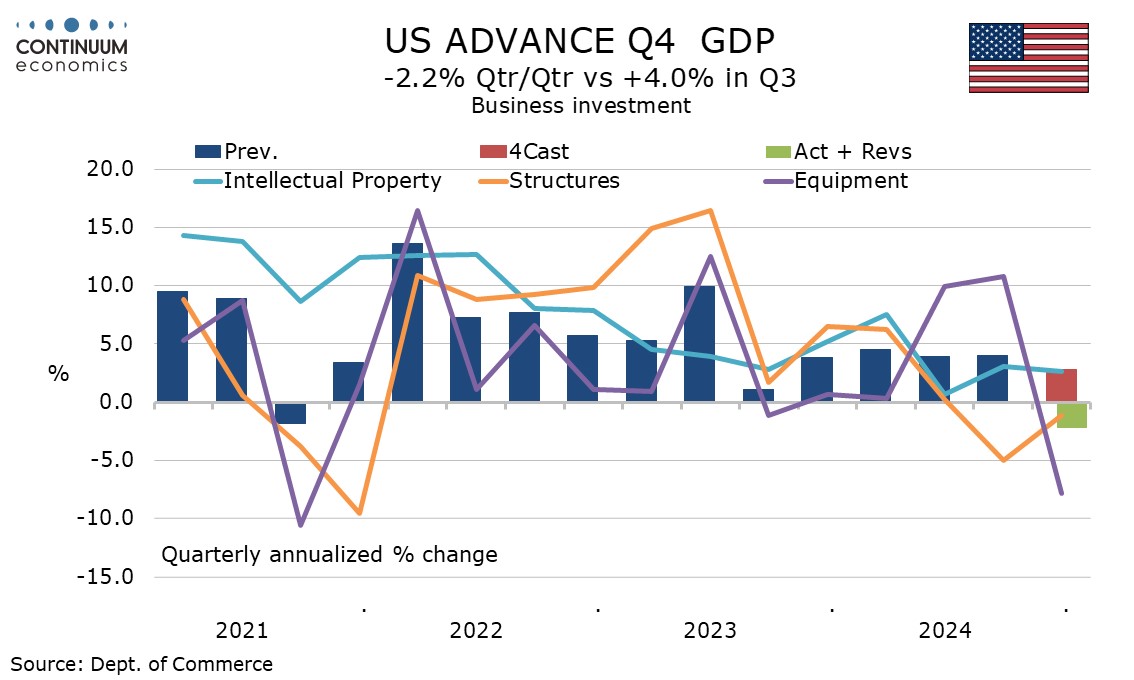
Residential investment picked up by 5.3% after two straight declines, suggesting Fed easing is having a positive impact, but business investment with a 2.2% decline showed the steepest decline since the pandemic, equipment at -7.8% correcting two straight gains of near 10%. Transportation equipment saw a particularly steep drop and may have been impacted by a strike at Boeing.
Government was solid with a rise of 2.5% though slower than the preceding two quarters. Final sales to private sector domestic buyers rose by a healthy 3.2%.
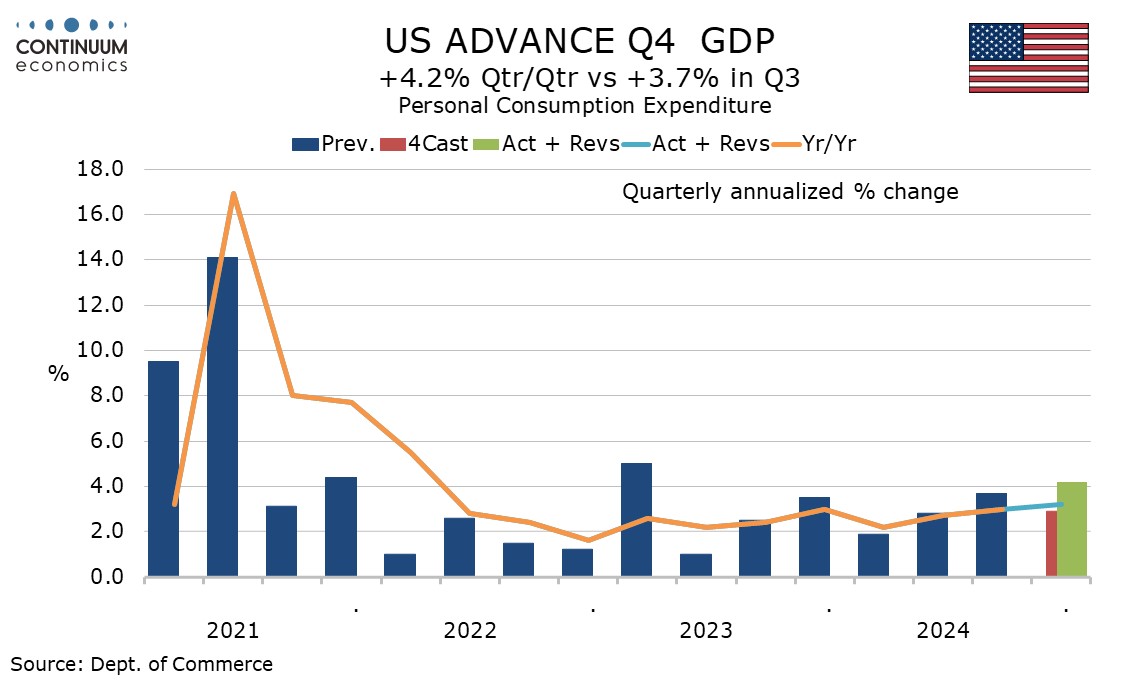
Still, the details are quite subdued outside a 4.2% increase in consumer spending, which was led by durables at 12.1% but nondurables at 3.8% and services at 3.1% were both solid. Consumer spending significantly outperformed a 2.8% rise in real disposable income, though the latter is far from weak.
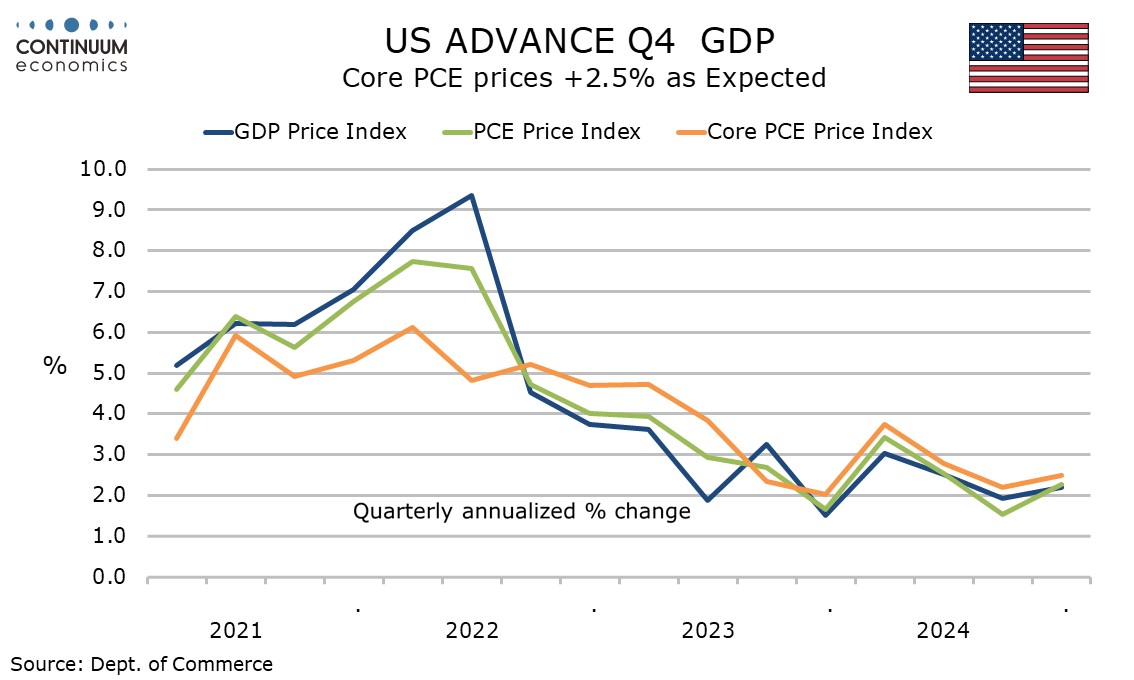
The 2.5% increase in the core PCE price index implies a 0.2% rise in December in data due for release tomorrow. The overall PCE price index at 2.3% and that for GDP at 2.2% were slightly softer than core PCE prices, if still above 2.0% and their Q3 outcomes.
Initial claims at 207k from 223k are surprisingly low in the week that follows the January non-farm payroll survey week. A fall in continued claims to 1.858m from 1,900m however covers the payroll survey week. While we expect January’s payroll to see some restraint from bad weather there is little suggestion in claims data of any labor market weakness.