Eurozone: The European Commission Diverges From the ECB on Inflation
The European Commission (EC) Spring Forecast projects real EZ GDP growth in 2025 at 0.9%, some 0.4 ppt below its previous (autumn) view. There is also a downgrade to the 2026 growth picture by 0.2 ppt to 1.4%, projections that carry downside risks and where we think they are still too optimistic. They do reflect the impact of increased tariffs and the heightened uncertainty caused by the recent abrupt changes in US trade policy and the unpredictability of the tariffs’ final configuration. Regardless, the impact of both weaker growth and the direct and indirect impact of tariff imposition is a much softer EC inflation outlook both relative to its previous thinking and that of the ECB (Figure 1). Indeed, after averaging 2.4% in 2024, headline EZ HICP inflation is expected by the EC to meet the ECB target by mid-2025—earlier than previously anticipated—and to average 1.7% in 2026 (ie matching CE thinking). This being a 0.2 ppt down grade with even the core rate pared by a notch to average 1.9% next year.
Figure 1: Pared-Back European Commission Inflation Thinking
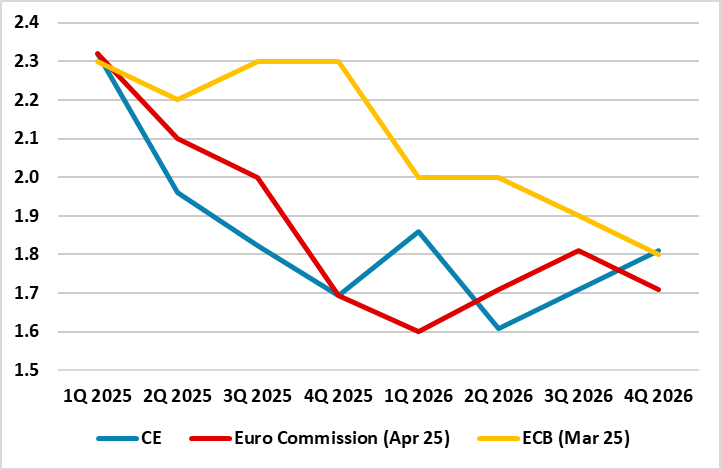
Source: EC, ECB, CE, % chg y/y
The Spring EC Forecast is based on certain assumptions about trade tariffs. Tariffs on US imports of goods from the EU, and virtually all other trade partners, were assumed in the model to remain at 10%, the level applied on 9 April, with the exception of higher tariffs on steel and aluminium and cars (at 25%). But, partly as a result, EZ disinflation is anticipated by the EC to proceed more swiftly than expected in its previous detailed forecast (last autumn), with new disinflationary factors from ongoing trade tensions outweighing higher food prices and stronger short-term demand pressures. In this regard, the EC estimated damage to growth from tariff is broadly in line with consensus thinking, the more important insight perhaps being the estimated disinflationary impact, one that chimes with our own thinking.
The latter partly stem from solid growth outcomes seen of late; late last year, the EZ economy grew by 0.4%, slightly surpassing the autumn projections as government consumption expanded vigorously and provided a larger-than-expected contribution to EU growth, mainly through employment growth in the government sector. Growth in private consumption also exceeded expectations towards the end of the year, driven by solid increases in disposable income as the economy added over 1.7 million jobs, and nominal wages recovered the purchasing power lost to surging inflation. EZ economic expansion continued in the first quarter, with real GDP growth increasing by 0.3%. However, investment fell short of expectations due to high financing costs and already high economic policy uncertainty. The considerable contraction in equipment investment and residential construction was only partially offset by infrastructure investment. High frequency data and partial information from national sources point to a relatively strong performance of consumption, non-residential construction and exports.
Figure 2: EZ HICP Short-term Dynamics Looking (Even) Softer
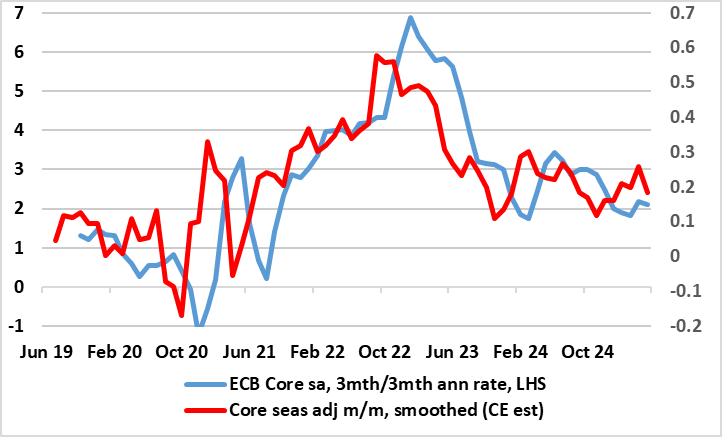
Source: ECB, CE
Regardless, the weaker inflation projection is notable, all the more so for the manner in which it departs from that envisaged by the ECB. Admittedly, it may be wrong to get too far sprung on any disinflation bandwagon as there is still much uncertainty about policy and developments ahead. In addition, some of the ECB’s preferred underlying inflation gauges (ie the PCCIs) seem to have stalled, albeit at levels consistent with the 2% target. But the tariff assumptions are certainly not unrealistic and the EC numbers also incorporate some degree of fiscal boost in Germany and more EU wide defence spending. In addition, the disinflation these is being supported by up-to-date data, not least seasonally adjusted core HICP numbers (Figure 2) as well as few signs that global trade tremors have (yet) damaged supply – the very opposite (Figure 3). The ECB’s forecast update next month looks all the more interesting, especially if the May flash HICP data deliver a below-target outcome!
Figure 3: Global Supply Factors Still Exerting Downward Price Pressures?
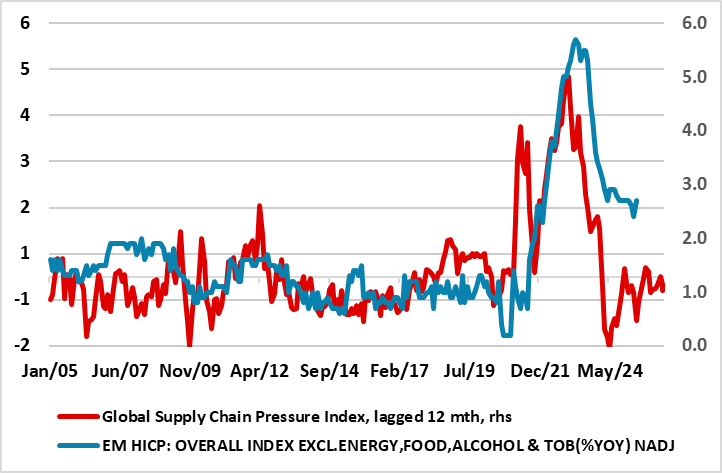
Source: New York Fed, Eurostat