EZ HICP Preview (Oct 1): Headline Back Below Target and Backed Up By Survey Signs?
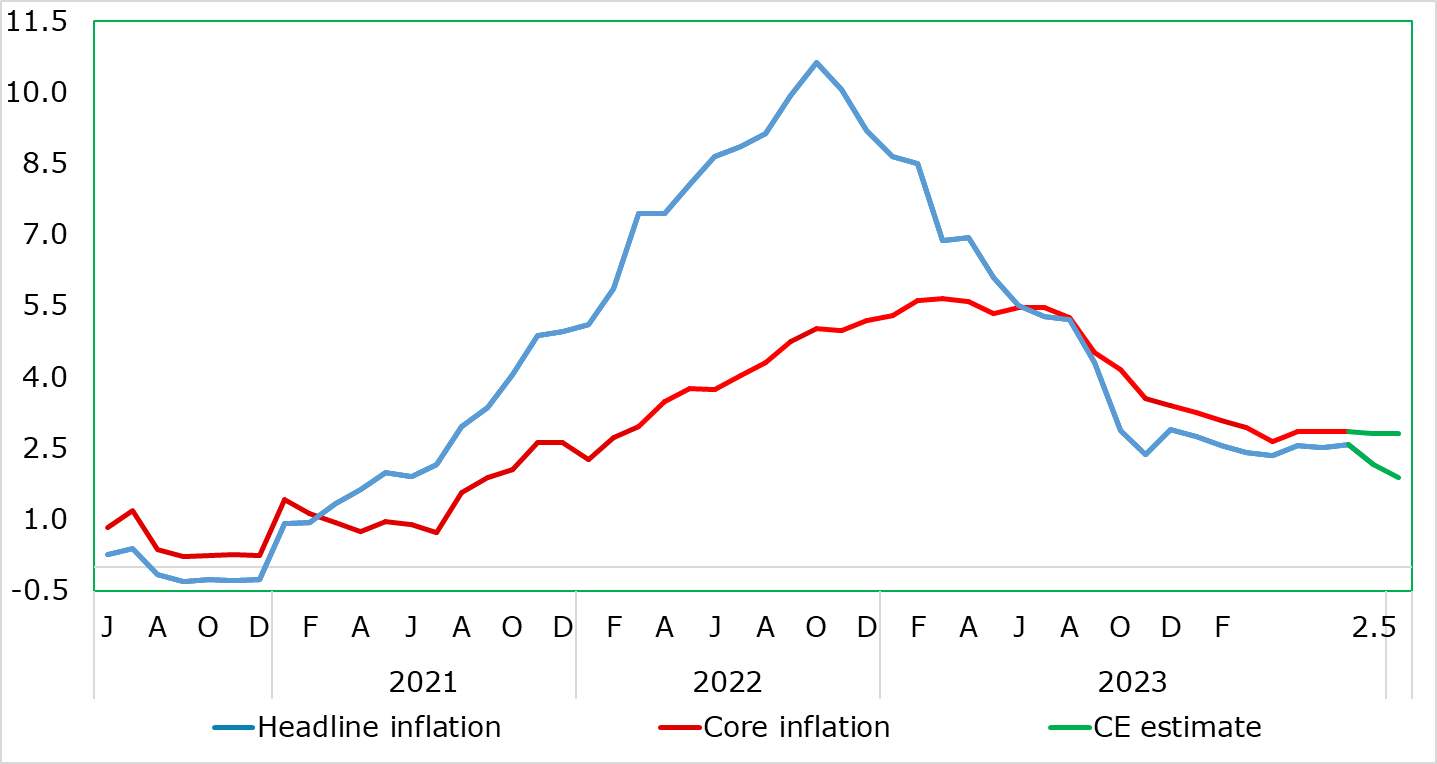
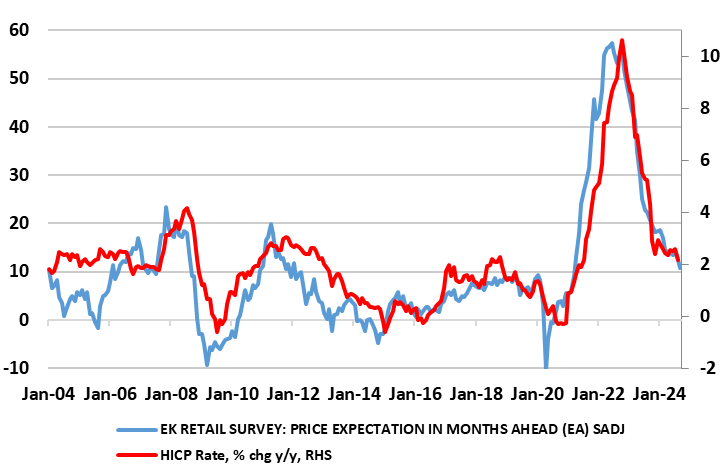
Lower fuel prices will be a key factor in September’s HICP numbers, and enough of a factor to pull the y/y rate to 1.9%, which would be the lowest in over three years and this despite still little material change in services inflation. Indeed, the risk is of an even lower outcome. This may be short-lived given adverse base effects later this year before a more sustained fall below 2% occurs through 2025. But the September projection is in line with ECB thinking as it leads to a Q3 outcome of 2.2%. But for the ECB, recent survey data, rather than just inflation, may be increasingly influential. Such data are pointing not only to more real economy weakness but also to significant falls in cost and output price pressures and retailers price expectations (Figure 3). The October Council meeting is getting ever more live and the ECB has plenty of opportunities next week to flag any change of mind!
Figure 1: Headline Below Target?

Source: Eurostat, CE
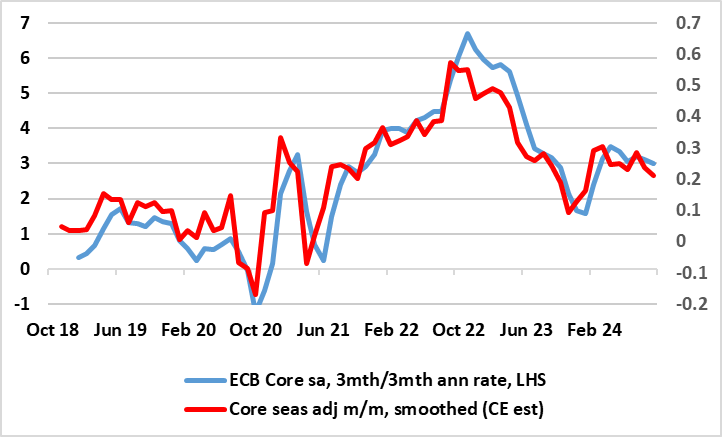
Amid some volatility in the headline y/y rate of late, it was notable that the August HICP saw the headline y/y rate resume its fall with a 0.4 ppt drop to 2.2%. This came in spite of services inflation rising a notch to 4.1%, although the core stayed at 2.8%. But we see abundant signs of the disinflation process in survey data and with the ECB’s own measures of persistent inflation pointing very much to already near, if not below, target inflation. This is also the case in terms of more short-run HICP dynamics (Figure 2). In addition, September HICP data from Spain and France very much support a clear fall below target this month for the EZ. These considerations are all the more important as the ECB hierarchy has made clear policy will be shaped by an array of data rather than particular data points!
If the headline rate drops to/below the 2% target this would be a full year earlier than ECB projections suggest. Perhaps the last mile for inflation is not the hardest, after all, for middle distance runners and most other experienced athletes the last mile is often the quickest as it sees a sprint finish! Admittedly, the drop in August and likely again in September will be very much energy biased, with services actually ticking higher to a 10 month high of 4.1%, this partly explaining what seems to be somewhat resilient core inflation measures, but this seems to be dissipating on a more short-term basis (Figure 2). Indeed, we see y/y services dipping below 4% in this September release.
Figure 2: Core Inflation Resilience Diminishes?

Source: Eurostat, European Commission
This services rate though is still well below that seen in many other DM environments and in August was probably boosted by the impact that the Olympics had in France, implying some softening back down hereafter. Even so, while headline inflation may slip to/below 2%, it may perk back towards 2.5% by end-year due to energy base effects. The ECB will have to take note of what will still be an undershoot of its expectations; the hawks on the Council will point to still apparently resilient services inflation, but where the doves may counter by pointing to what is a much earlier than expected drop below target as well as recent much softer wage inflation news and real economy signals. Indeed, PMI survey data pointed to both weaker activity and cost pressures
In fact, and notably given the extent to which disinflation to date has been very much supply driven, the September PMI numbers suggested that a weakening demand environment contributed to softer inflationary pressures in which the rate of input cost inflation slowed sharply, easing to the lowest since November 2020. Manufacturing input prices decreased for the first time in four months, while service providers posted the weakest rise for three-and-a-half years. In turn, output prices increased only slightly, and to the least extent since February 2021 when the current sequence of inflation began. A slower rise in services charges was accompanied by a renewed fall in manufacturing selling prices. Slower increases in output prices were seen in Germany and the rest of the EZ, while charges in France decreased for the first time since February 2021. This pattern of disinflationary signals is backed up by European Commission survey data, most notably in terms of retailer’s price expectations (Figure 3).
Figure 3: Survey Data Backs Up HICP Disinflation Picture?

Source: Eurostat, European Commission
All of which is putting the October ECB Council meeting very much into line as a live event despite it being suggested last time around there would not be enough new data to warrant a policy easing at that juncture. Notably, the ECB in the coming week has plenty of opportunities to flag any change of mind. Indeed, here is an array if ECB speakers next week, the most notable being President Lagarde who testifies to the EU Parliament on Monday – will the weaker survey data seen of late feature in her remarks or that from any of her colleagues?