U.S. Yields and an Equity Market Correction

Treasury yields look to have reached a level that the divergence in valuations means that equities are on the defensive. Unless U.S. Treasury yields come down then the S&P500 looks to be heading to 5400-5600 near-term. This is most likely a correction given that the Fed is likely to still leave the door open to less restrictive policy in late 2025/2026, while the U.S. economy and credit markets are not flashing warning signals. Even so, a major policy mistake could boost 10yr yields above 5%, which would deepen any correction.
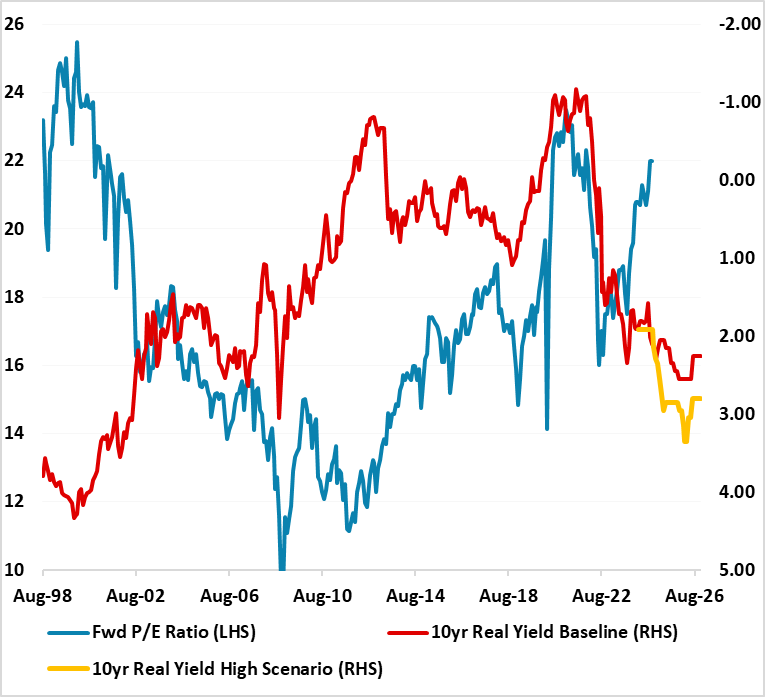
Figure 1: 12mth Fwd S&P500 P/E Ratio versus Inverted 10yr Real Yield (%)

Source: Continuum Economics (using breakeven inflation and forecasts to end 2026)
The rise in U.S. Treasury yields since the start of December is starting to be noticed by risky markets including U.S. equities that have pulled back from the highs. Fed easing expectations have been reduced to the point that the market has a broad sense that only one 25bps easing could arrive late 2025 and the Fed is on hold in the meantime. However, the rise in long-dated yields also reflects concerns among investors that the budget deficit could be higher than the 6.5% of GDP that the CBO will likely forecast for 2025 and 2026 this Friday. Treasury yields look to have reached a level that the divergence in valuations means that equities are on the defensive.
The gap between the 12mth forward P/E ratio and 10yr real bond yield (Figure 1) is large and approaching the 2000-2003 period when equity multiples derated aggressively. The argument is that tech companies are now profitable and their earnings growth is 15% plus. That is certainly true for now, but tech companies need to avoid a slowdown in earnings growth that could dent the story or a hiccup in the AI story. Meanwhile, the rest of the market is also overvalued and liable to competition from high bond yields. In our December Outlook, we had thought that an equity market correction would come in H2 and 2026, but it looks like this occurring in H1. Unless U.S. Treasury yields come down then the S&P500 looks to be heading to 5400-5600 near-term. Even so, the U.S. equity market would remain clearly overvalued on the basis of Figure 1 and any bad news for U.S. Treasuries that push yields through 5% could prompt a deeper correction in equities (e.g. aggressive tax cuts or tariffs from the incoming Trump administration). Our baseline 10yr real yield is based on a nominal yield only going just above 5% in 2026, but the alternative adverse scenario of high real yields is based on 10yr nominal yields going above 5% in Q1 and up towards 6% into early 2026 – the resulting divergence is then very large.
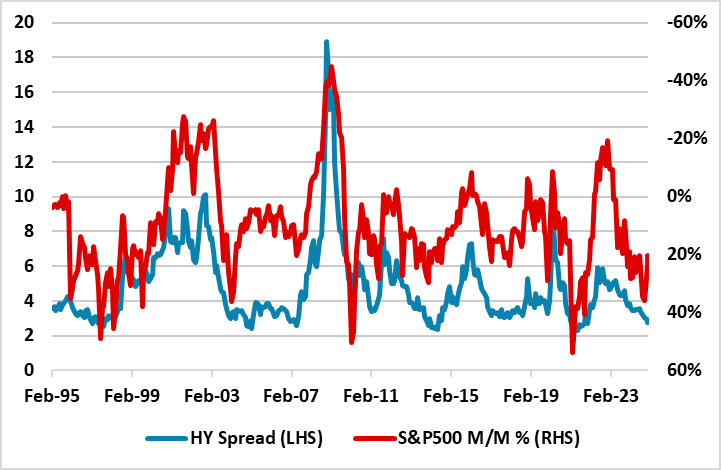
Figure 2: U.S. High Yield Spread and Inverted S&P500 Yr/Yr Change (%)

Source: Datastream/Continuum Economics
Nevertheless, bad news could arrive if the incoming Trump administration makes a major policy mistake, which is possible given the fluid nature of decision making. For financial markets, the highest impact would come from an aggressive tax cutting package that means an 8-9% budget deficit in 2026 or universal tariffs that have a persistent effect on U.S. prices and cause a stagflation shock. While threats against Greenland/Panama are serious, they could also be political deflection or theatre to avoid the spotlight falling on other issues (e.g. peace deal for Ukraine).