Eurozone Flash GDP Preview (Jul 30): A Pause that Does Not Refresh?
For an economy that has seen repeated upside surprises and above trend growth of 1.5% in the year to Q1, GDP data do not seem to have had much impact is shaping, let alone dominating, ECB policy thinking. We think this will continue to be the case even where the looming Q2 data may show a modest contraction (Figure 1). Admittedly, any such a fall may merely be seen as a correction to what was an upwardly distorted Q1 result and will continue to see marked divergences within the main EZ economies. But while real economy considerations are now the major policy factor, the ECB seems to be in a much more risk management frame of mind and where policy freedom has been granted by clear disinflation. Those risks are obviously (but not solely) centred around the tariff outlook and where they are largely seen as pointing to the downside for both growth and inflation. This helps explains our below consensus outlook for the EZ, this creating the rationale for two more 25 bp ECB cuts in H2. This view is reinforced by the latest ECB bank lending survey which suggested that for firms perceived risks related to the economic outlook continued to contribute to a tightening of credit standards.
Figure 1: Weaker But Still Divergent EZ GDP Picture?
Source: Eurostat, Continuum Economics, Bloomberg
Continuing a series of upside surprises, EZ GDP overshot both consensus and ECB expectations in Q1, even more so after what was an eventual 0.3 ppt upward revisions compared to the flash. We see a correction back in Q2 data (Figure 1), albeit accepting some upside risks reflecting recent m/m increases in both manufacturing and construction that both conflict with softer survey messages but still show geographical divergences. Regardless, even though the flash GDP is released just a few weeks after the quarter it relates to, it may be even more effectively historic this time around. This is because whatever message it does provide it will offer little guidance to the months and quarters ahead where the U.S tariff threat looms larger and threateningly, as the EZ PMIs and European Commission survey data both very much highlight.
Notably, that above-trend growth in the last year came alongside what has been significant disinflation, this very much supporting our long-held view that weaker price pressures of late have been mainly supply driven and thus where weaker demand ahead could prolong, if not accentuate, such disinflation. Indeed, this weak(er) demand picture is reinforced with business sentiment the lowest for well over two years particularly once construction survey numbers are included. We see flat GDP for this and the next quarter, with 1% 2025 average growth and little less in 2026 but with downside risks!
Irish Tail Wagging the EZ Dog?
As hinted above, there is a certain irony that for an ECB Council that has evidently shifted its main focus away from broadly falling inflation to real economy weakness, this has come amid GDP resilience that has included signs of a consumer recovery. But the ECB will be as aware as everyone the extent to which recent GDP numbers may be giving a misleading picture, actually offering little insight into underlying activity. Indeed, recent GDP data gains have been predicated on both a surge in Irish GDP as well as what was seems to have been an inter-related EZ export jump in anticipation of the US tariff imposition from April. The latter jump is likely to reverse, this partly explaining the widespread expectation for a Q2 contraction and one which may unwind additionally in this and coming quarters – the ECB actually points to a contraction in Q3. But this uncertain and volatile backdrop is no single-quarter aberration; EZ GDP growth has been very dependent upon Ireland for the last year, the latter accounting for half the y/y growth seen into Q1 (Figure 2). This is unstable and unsustainable and to us suggests that the jump in GDP will have made little inroad in the EZ output gap. Regardless, the data do suggest a marked pick-up in productivity growth has occurred of late, which may be somewhat more persistent given the labor hoarding the EZ economy has seen in the last few years.
Figure 2: EZ Growth Inc and Ex Ireland
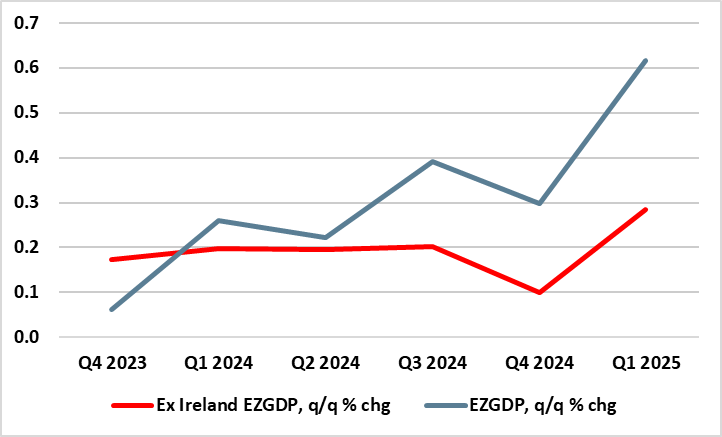
Source: Eurostat, CE
Indeed, with EZ y/y growth up to 1.5% in Q1, and employment rising half that, productivity (in term of output per employee) rose to 0.8%, twice what the ECB has pencilled in for the while for 2025 and more in tune with its 2026-27 projections. Moreover, productivity in term of output per hour was even more impressive as hours worked have hardly risen in the last year, this possibly a result of the labor hoarding alluded to above. If the latter is so, it does suggest perhaps a more sustained productivity rise as any further rise in activity is unlikely to be based around significant employment advances.
Regardless, an export led Q1 GDP jump was far from unique to the EZ as far as W Europe is concerned. In Switzerland, GDP jumped 0.5%, this on the back of a jump in goods exports (mainly pharmaceutical sales to the U.S.) that boosted the economy by two ppt for a second successive quarter. The UK saw something even higher, albeit its export sales based more around other goods, such as vehicles. And the EZ joined in the party as Ireland produced another quarter of export and GDP is estimated to have grown by 7.4% in the quarter. In context, Irish Gross National Product, which is a measure of economic activity that excludes the profits of multinationals, decreased by 2.1% in the quarter.
Overall we caution about extrapolating from recent Western European strength –if the EZ joined the party, it must remember that parties do not last and can result in hangovers! This is especially so in the current context where the U.S. is hardly interested in granting Europe early or advantageous trade deals – the very opposite.
Broader Downside Risks
As for the tariffs, given what we know at present, models that include both short and long-term estimates foresee an overall GDP drop of about 0.3 ppt for the EU/EZ, albeit where such estimates do not account for all effects, such as the risks posed by a financial crisis in the US. This is based on a central assumption of 10% underlying tariff, but that looks too low with ensuing downside risks as painted by recent ECB modelling (Figure 3). But there are added downside risk. Firstly, in terms of financial conditions, one stemming, if not accentuated, from EZ banks being less willing to lend as they reduce their risk tolerance and raise their perception of risk, given fears of a spill-over of a potential recession. Indeed, the latest and just-released ECB bank lending survey (BLS) suggested that while banks mostly reported no specific additional tightening impact on their credit standards from geopolitical uncertainty and trade tensions, they intensified their monitoring of the most exposed sectors and firms. But for households, banks reported a small net tightening of credit standards for housing loans and a more pronounced net tightening for consumer credit reflecting changes in risk perceptions and their reduced risk tolerance. This si all the more notable as it possibly explains what have been weaker actual credit numbers of late
Figure 3: The ECB Current Tariff Scenarios
Source: ECB June forecasts - baseline sees GDP growth of 0.9% (25), 1.1% (26) & 1.3% (27)
Secondly, the message from business surveys is that hitherto solid services (which have been the main support to growth of late seems to be slowing). Indeed, both sets if data have also been hinting that hitherto services sector resilience may be dissipating, something now backed up by official numbers and also a possible factor behind the weak(er) labor market backdrop we now see unfolding.