China: Too Much Debt In Some Sectors
While part of corporate debt is quasi government (SOE and LGFV’s) and China creditors can be pursued to rollover by the authorities for larger borrowers, households and part of the private sector are focused on the previous buildup of debt. With China authorities reluctant to aggressive ease fiscal or monetary policy, this means that these sectors can remain a drag on growth.
Economists tend to look at the cyclical dynamics, but household lending and private investment trends suggests that key sectors are suffering from a structural overhang of debt built up over the last 30 years.
Figure 1: Debt/GDP Total and Key Sectors (%)
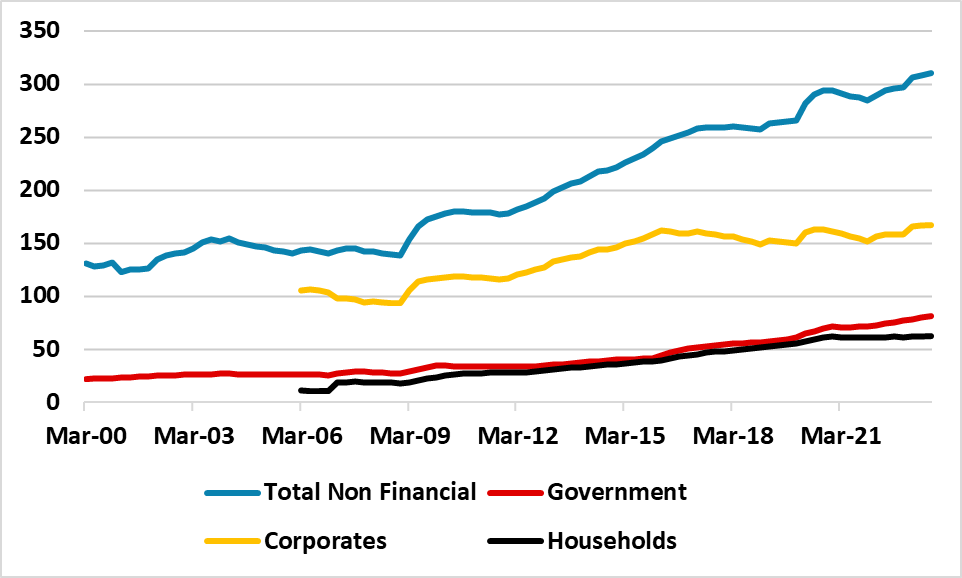
Source: BIS
China has seen a consistent rise in debt/GDP trends over the past 25 years (Figure 1), with contributions from government, corporate and households. The change since Q1 2007 has been particularly quick (Figure 2), which in previous experience has normally been followed by a period of debt consolidation or decline. The most well-known is the Japan boom and bust in the 1980’s and 1990’s, but the U.S. household sector deleveraged after 2006 and many DM countries undertook financial repression in the post-world war 2 period to reduce government debt/GDP.
Figure 2: Change in Debt Q3 2023 v Q1 2007 (%)
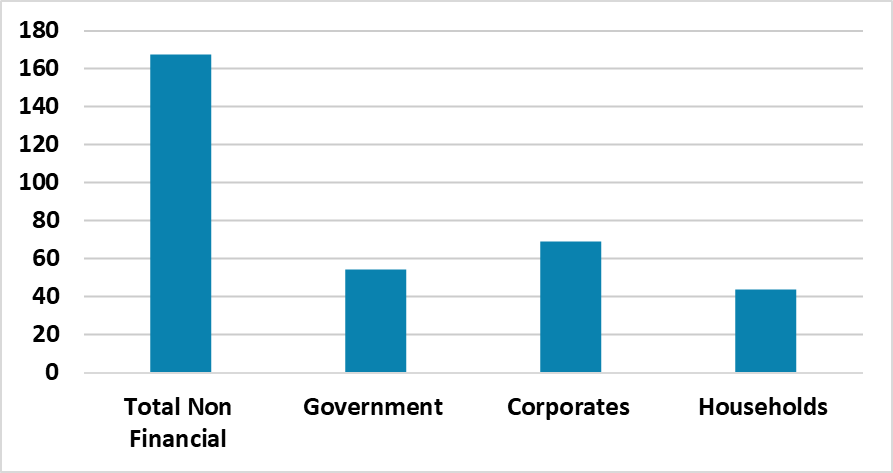
Source: BIS
It has been argued that China is different for two reasons. Firstly, a fair portion of corporate borrowers are SOE’s or LGFV’s, which are quasi government debt and in a crisis would likely be bailed out by the government – as occurred in 2015 for some LGFV’s. While this would add to government debt, governments tend to have more flexibility to issue longer-dated debt than corporates/households. Secondly, debt in China is overwhelmingly domestic owned and in Yuan. Furthermore, China authorities have strong powers of persuasion and convinced creditors in 2020 to just rollover debts during the COVID crisis. However, these are mainly reasons for think that the debt problem does not become a 2007/08 type major financial crisis for China. Economic pain still exists from too high debt, especially in the private sector.
Household lending swung negative Yr/Yr in the latest total social financing figure (here), while private investment has also been sluggish (partially due to previous debt build-up but also the crackdown on private sector excess). So far the official policy has been to promote production in high tech sectors to meet the 2024 GDP growth target, alongside some targeted fiscal easing. However, China authorities are reluctant to use aggressive fiscal policy expansion given the unofficial size of the government sector – while weaker LGFV’s have been encouraged to cutback investment growth.
One solution is higher nominal GDP growth, which reduces the domestic debt/GDP, if nominal GDP outstrips debt growth. However, the days of 10% plus nominal GDP seen between 2000-13 have gone (Figure 3) and 2024 nominal GDP will likely be in the 5.0-5.5% range depending on the real GDP outcome. This means that fast nominal GDP growth is unlikely to bail out debtors in China and they are left focusing more on debt servicing and eventual debt repayments and this can hurt current economic activity. Some reduction in debt servicing costs can come through lower interest rates, but the authorities are reluctant to ease too far (here). This means the adverse impact of debt will continue to hurt China economy and this is one of the reason why we forecast 4.0% 2025 GDP growth and look for further slowing multi year (here).
Figure 3: Nominal GDP and 5yr Average (Yr/Yr %)
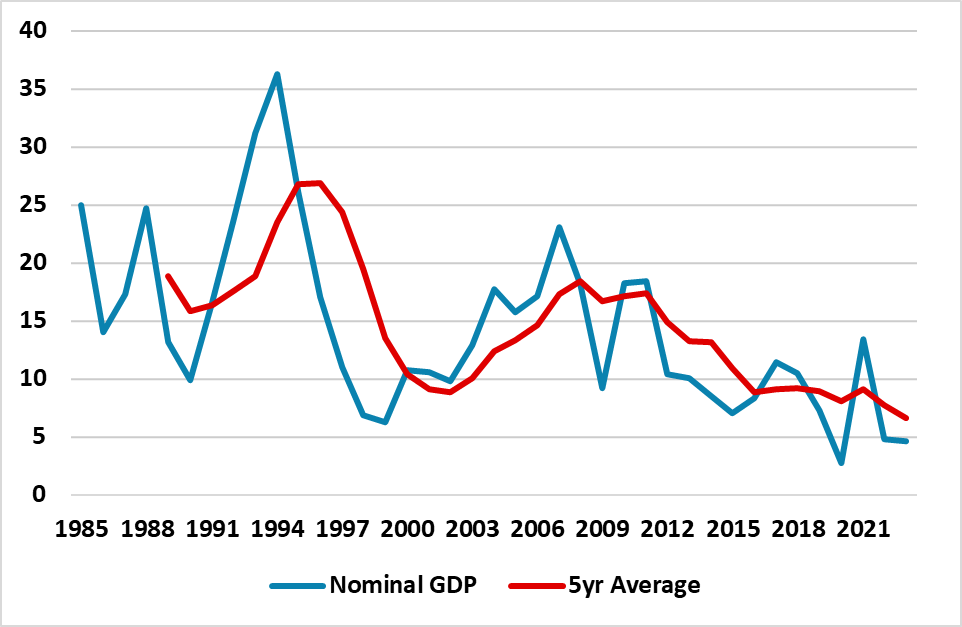
Source: Continuum Economics