UK CPI Review: Goodbye to the Good Old Days?
After January’s clear fall, even in the core rate, where the headline CPI rate fell from December’s 3.4% to 3.0% (a 10-mth low) it stayed there in February’s numbers – matching both consensus and BoE projections. Services fell 0.1 ppt to 4.3% which was a four-year low (Figure 1) but the core edged back up a notch due to higher non-energy good inflation. They were offset by slightly lower fuel prices, hardly a foretaste of what is to come in coming months as the Middle East conflict spills over with petrol prices as they were by mid-March likely to add 0.3 ppt the headline rate (Figure 2). On the basis of our baseline 4-8 week war thinking, we see the headline CPI up to 3.5% in March but then falling back for a while before moving back to 3% in Q4 but then dropping back through 2027 to average 2.1%.
Figure 1: Headline Stable But Core Higher
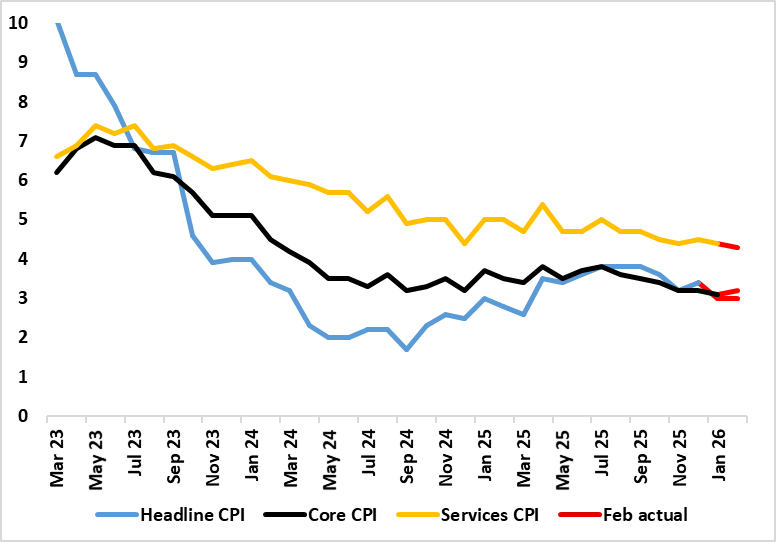
Source: ONS, Continuum Economics, % chg y/y
Admittedly, not all aspects of the CPI data were reassuring, albeit with a fresh fall in catering services inflation, often seen as an indicator of price persistence given that the sector’s cost base is very much wage related. Even so, the evidence on this is mixed with HMRC pay data very clearly showing a slowing in wage inflation for accommodation and food services. Regardless there are very clearly reassuring aspects most notable in still low lower rental inflation which at just over 3% has more than halved in the last year, surely an added sign that the housing market is in the doldrums. But there was also a fresh rise in non-energy goods inflation which came in spite of both weak global demand and dumping of goods by China once destined for the U.S.
But these February data will be considered to be old, if not irrelevant, news. But the calmer CPI numbers of late provide contrast with the energy storm ahead, with a jump in in fuel inflation already very much embedded into retail prices (Figure 2).
Figure 2: Petrol Prices Already Chiming with Oil Surge
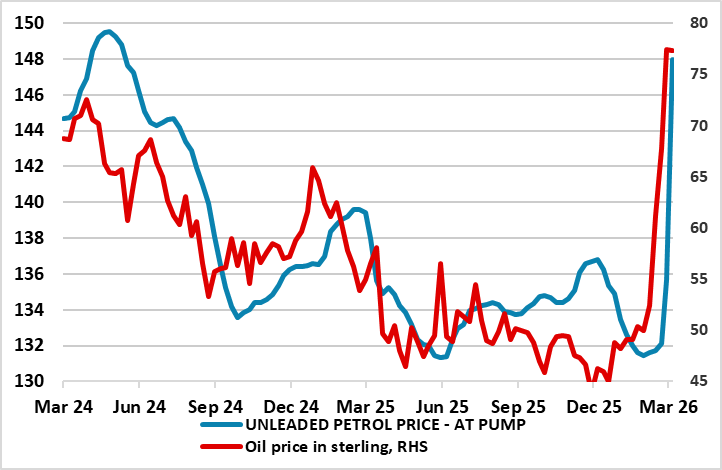
Source: ONS, Continuum Economics, RAC
These will unnerve the BoE with the MOC hawks crowing already. But it is notable that real activity indicators are already flashing worryingly with the March CBI retailing survey at its weakest since the GFC.