UK CPI Review (Dec 18-19): Still Mixed Inflation Signals
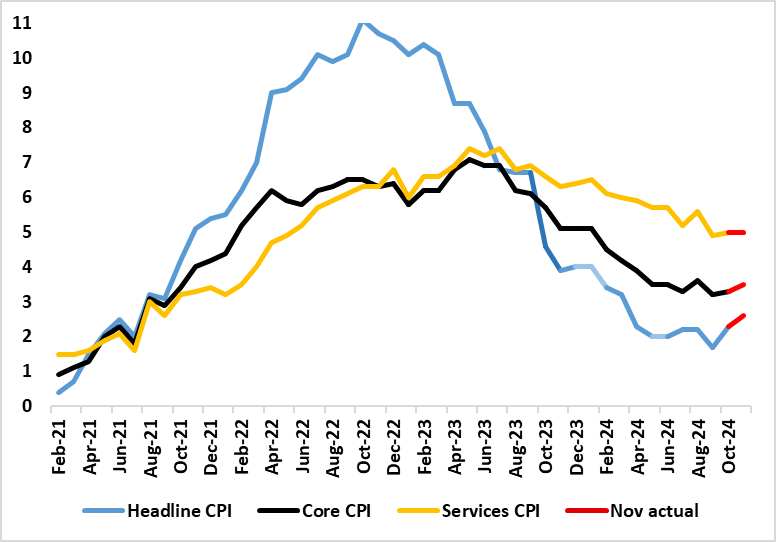
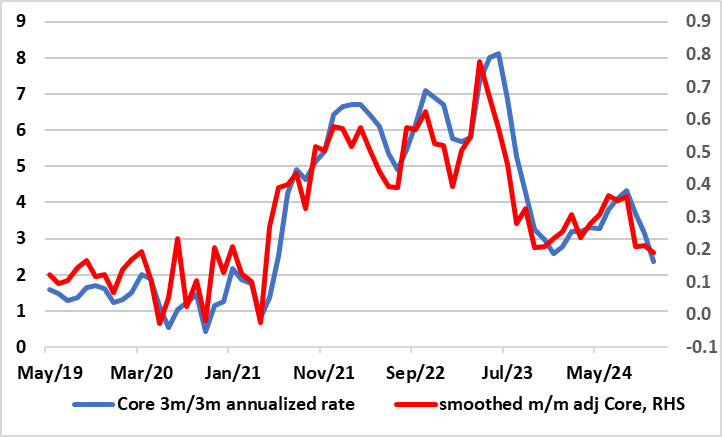
While exceeding both our and BoE thinking, November CPI inflation jumped 0.3 ppt to 2.6%, actually an eight month high. Services inflation remain ned at 5.0% while the core rose 0.2 ppt to 3.5%, also exceeding Bank projections (Figure 1). The data comes after more cost pressure worries were fanned by earnings data in the latest labor market numbers. But those numbers also showed clear(er) signs of falling employment and those payroll figures also questioned whether wage growth has indeed picked up. What is clear is that the economy is stagnating, and that this predates the Budget, very much asking to what degree it is BoE policy that is still very much hindering activity. Clearly the data will keep the MPC majority on hold this week, but looking at the CPI details, adjusted data still paint a much softer picture than that based on base effect y/y numbers (Figure 2).
Figure 1: Services Inflation Yet to Slow Convincingly?

Source: ONS, Continuum Economics
Overall, we see the BoE vote verdict on Thursday having at least one dissent, but with the MPC largely adhering to its new scenario strategy with a central view that has allowed Governor Bailey to flag around four 25 bp cuts next year, albeit where some of the hawks may suggest more resilient inflation as they will note that after a period when inflation undershot its thinking, it has now started to overshoot. If so, is that an indictment of BoE projections than a clear suggestion that price pressures have picked up. We still see a little more than that still in the coming year!
The Inflation Picture – More Benign in the Details?
Thus the BoE has plenty of data to assess ahead of its decision next week. As for inflation, coming in as largely expected and above BoE thinking, CPI inflation jumped to 2.6% in October, partly due a swing in fuel costs, amplified by base effects. The data also showed a fresh rise (of 0.2 ppt) in both the core inflation to 3.5% and it noteworthy that nine of the 12 CPI components picked up. Nevertheless, the CPI data backdrop is still consistent with underlying inflation still having fallen, especially when assessed in shorter-term dynamics (Figure 2) something that was repeated in these November data.
Figure 2: Clear Adjusted Core Inflation Drop Continues?

Source: ONS, Continuum Economics