UK CPI Preview (May 20): Inflation Sedate For Now But Wages Still on the Wane?
What are energy induced price rises are now very evident, most notably in PPI data as well as the more closely watched CPI figures. Thus after a stable 3.0% (a 10-mth low) February’s headline – matching the consensus, headline CPI jumped to 3.3% in March. Services, however, rose from 4.3% a four-year low (Figure 1) to 4.5% on the back if what may have been early Easter induced airfare rises, but the core still edged down a notch due to lower non-energy good inflation (Figure 1). Much softer inflation readings are seen in the April, data both as Easter effects unwind and also those from the array of service and utility prices rise of year before compounded by the OFGEM-induced energy price cap cut in prices. Indeed, we see the headline done to 3.1% despite a circa 6% rise in fuel related energy, this offset by services dropping almost a full ppt, taking the core down to 2.5%. But base effects are not the full story as even adjusted, smoothed m/m data are offering more subdued signs as are company price expectations (Figure 2) and actual recent wage pressures (Figure 3).
Figure 1: Headline And Core Much Softer?
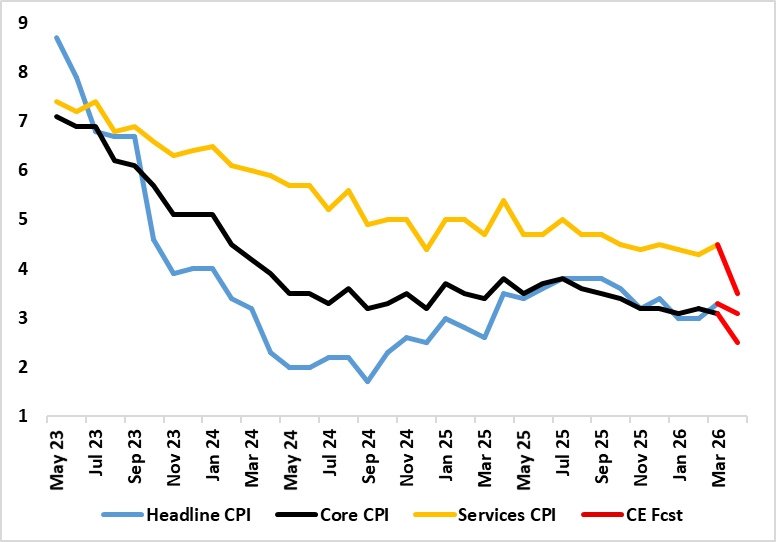
Source: ONS, Continuum Economics, % chg y/y
Of course this is the calm before the storm, but the fact is that the calm seems more serene than expected until of late – something not unique in Europe to the UK. Admittedly, our April headline is a notch above BoE thinking, seemingly due to fuel prices. But even here the notable thing is that neither unleaded or diesel prices have followed oil prices in the latter’s recent rally – indeed, both are down in m/m terms in May – is this an indication of demand resistance by consumers!
The main factor is surely favourable base effects this April as those upward pressures a year before wash out. Back in the April 2025, airfare prices rose by 27.5% on the month, the second-highest monthly rise for any April. The rise in the headline rate reflected large upward effects from gas and electricity, which resulted from the raising of the OFGEM energy price cap in April 2025. Prices of water and sewerage rose by 26.1% in the month to April 2025, the largest since at least February 1988.
Figure 2: Companies CPI Expectations
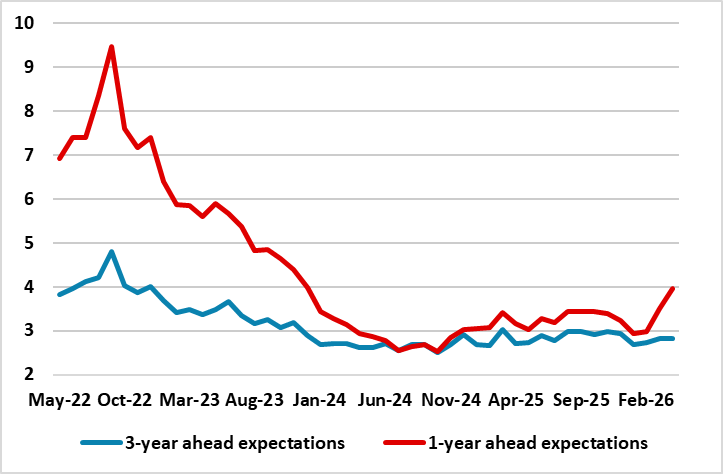
Source: ONS, April BoE Decision Makers Survey, % chg y/y
But obviously, the April CPI data are likely to show little, if any’ signs of second-round effects, possibly the opposite especially looking at adjusted m/m numbers (Figure 2. But the next few months will be a different, not least as oil price gains may be more persistent than we thought a month ago. But the CPI rate may still be around 3% by year end, some 20-30 bp higher than we previously thought but still some 0.5% ppt below BoE thinking
This latter view very much reflects a position where we see little second round effects, with even the latest BoE MPR suggesting firms do not have much pricing power especially compared to four years ago with very little expectation of any pick-up in wage growth to come. An unwillingness to raise wages may also reflect company thinking that the medium-term inflation has not changed. Moreover, we would argue that households will not have much wage bargaining power either even if their inflation expectations have risen somewhat. This comes against a backdrop where wage inflation has already slowed continually and clearly and where this trends may continues in the next labor market report (May 19).
Indeed, private sector regular earnings are now running at below 3%, the lowest since pandemic related pressures softened them in mid-2020 (Figure 2). This private and regular measure of earnings is the barometer the BoE use to gauge wage pressures and is now running at a pace consistent with the 2% CPI target, this on the assumption of productivity growth of around 1%. But what is key is that private sector earnings are growing well below the 7%-plus pace seen before the Ukraine War started four years ago – all of which is likely to reinforce, if not accentuate, already-clear signs of damage to demand.
Figure 3: Weaker Wage Pressures Increasingly Evident?
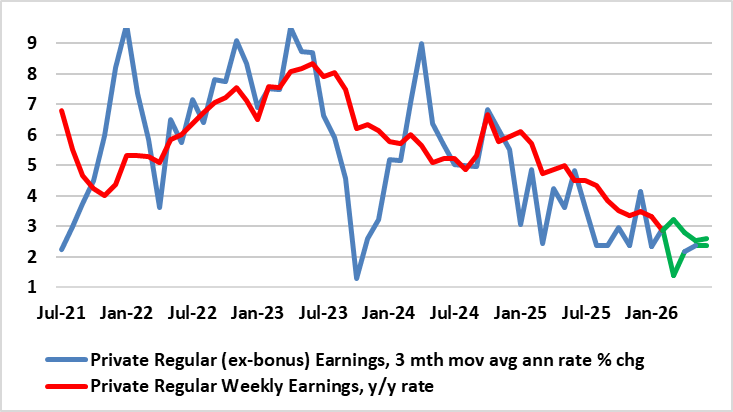
Source: ONS, CE, green lines are CE projections