DM Rates Outlook: Tightening or Easing?
· With the U.S./Iran interim agreement likely to hold and energy prices softening, our projected consumer slowdown will likely tilt the Fed not to hike in H2 2026 and to actually ease by 50bps in 2027, with 25bps moves in both Q2 and Q3. With 2yr yields consistent with a hike, the trajectory will likely be a gradual decline through H2 2026 and then H1 2027 down to 3.50%. 10yr can move to the bottom of the 4.20-4.60% range, but with yield curve steepening in the next 12 months.
· In EZ, we expect that 2027 easing when it arrives to be accompanied by some steepening in the short-end to the policy rate to limit any further 2yr yield downside to 2.3%. 10yr will likely be stuck just below 3% helped by rate cuts but underpinned by ECB QT/German fiscal expansion.
· For 10yr yields, BOJ QT is more important than gradual BOJ policy rate normalization. Though the BOJ are keeping Y2trn pm gross bond buying, huge redemptions mean that the BOJ is projecting its balance sheet to reduce materially by 6.5% of GDP between April 2027-March 2028, after 2026’s 6% of GDP! With a modest budget deficit, this is a huge amount of debt for the rest of the market to absorb. This will require higher real yields and a still larger term premium. It is difficult to see 10yr yields below 2.5% and we feel a spike through 3.0% is a real prospect in the next 3-12 months.
Risks to our views: Upside inflation risks have been removed with the U.S./Iran interim deal and our alternative scenario (20%) of Iran threatening a temporary closure of the Straits of Hormuz on Israel attacks on Lebanon would only add around 10% to oil prices (here). The main macro risk is that the lagged effects of the higher energy prices March-June 2026 could cause a greater growth hit than expected. This would accelerate the shift for some DM central banks from tightening risks towards 2027 easing.
Figure 1: Fed Funds, 2, 10 and 30yr U.S. Treasury Yields Forecasts (%)
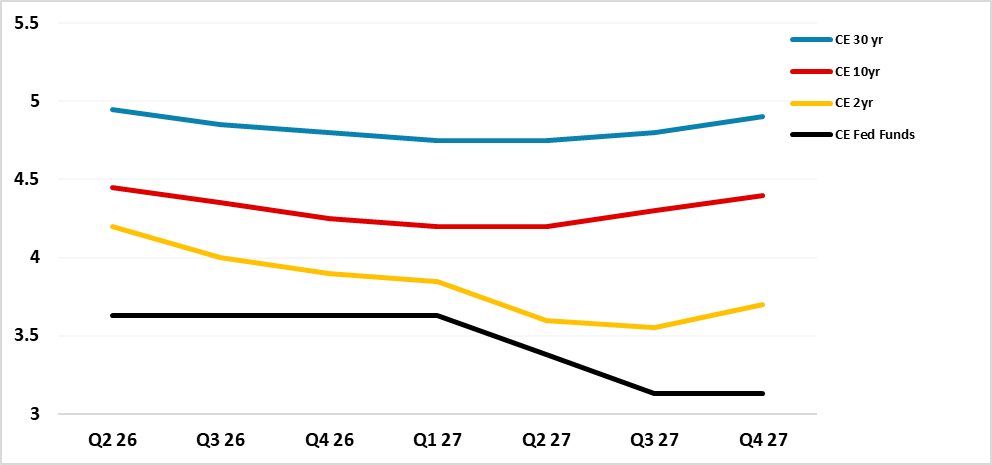
Source: Continuum Economics
Though the dots in the June FOMC were biased towards one 25bps 2026 hike (here), 7 of those providing forecasts are non-voting and skewed the dots to a hawkish read. We take the view that the FOMC voters including Warsh will keep policy rates on hold through 2026, as consumption softens with the slowdown in income growth and the household savings rate already low. Indeed, with the U.S./Iran interim agreement likely to hold and energy prices softening, the consumer slowdown will likely tilt the Fed to ease by 50bps in 2027, with 25bps moves in Q2 and Q3. With 2yr yields currently consistent with a hike, the trajectory will likely be a gradual decline through H2 2026 and then 2027 cuts deepens the 2yr yield decline (Figure 1). Even so, a clear swing to a premium of 2yr versus Fed Funds rate occurs in the mature stage of an easing cycle (Figure 2). We see this spread drifting up to 50bps in H2 2027, as the market debates whether the AI demand boom could lead to a rate hike in 2028.
Figure 2: 2yr-Fed Funds Spread and Fed Funds Rate Inverted (%)
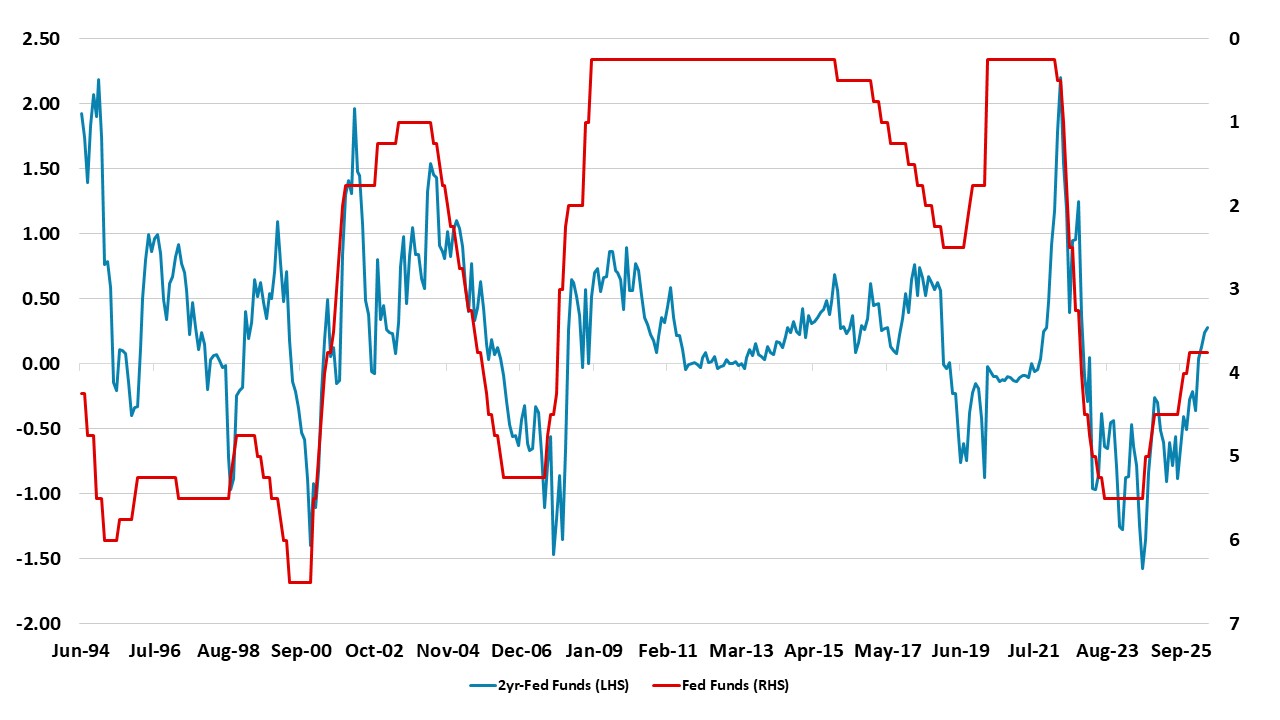
Source: DataStream/Continuum Economics
In terms of 10yr yields, the scale of the budget deficit argues for 2% real yields, while the persistence of core PCE above target means that yields are currently centered around 4.20-4.60%. The consumer slowdown we projected followed by a reduction in the Fed Funds rate in 2027 can combined to produce a move to the bottom of this range, but it would take a harder landing to produce a consistent move below 4% yields (Figure 4). Additionally, the 10-2yr is not particularly steep by history standards (Figure 3) and we would expect yield curve steepening until mid-2027 and this will slow the decline in 10yr yields. In terms of a risk off shock prompting a flight to quality, we see the U.S. equity market as liable to 10% corrections but no worse, provided that AI labs revenue remains strong. Even so, private credit could cause some jitters, though this will likely produce a temporary boost to UST prices.
Figure 3: 10-2yr U.S. Treasury and Fed Funds Inverted (%)
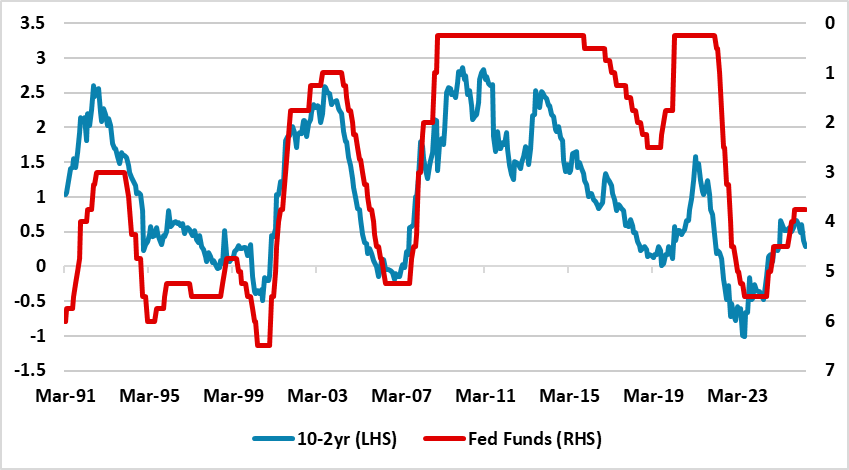
Source: DataStream/Continuum Economics
In terms of alternative scenarios, the risks are split between too much inflation from the AI boom combining with the temporary inflation from the Iran war, to prompt the Fed to actually hike rates in contrast to our view (here) – we attach a 15% probability to this scenario. Such a scenario would likely be two 25bps hikes, which would likely lift 10yr yields to 4.75%. The alternative is that the consumer slowdown is quicker than we expect (25% probability) and this leads to earlier and deeper Fed cuts that drags 10yr yields below 4.0%.
Figure 4: 10yr U.S. Treasury Scenario Analysis
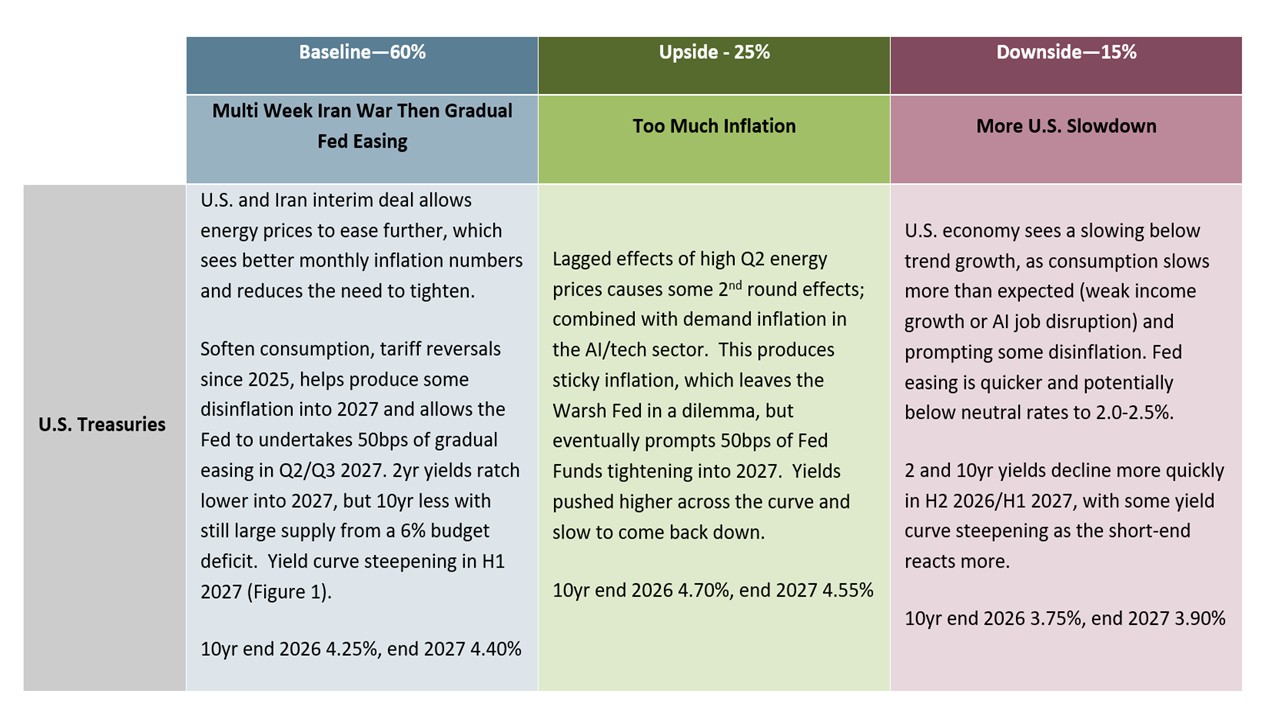
Source: Continuum Economics
Figure 5: 2026 Budget Deficit and QT to GDP (%)
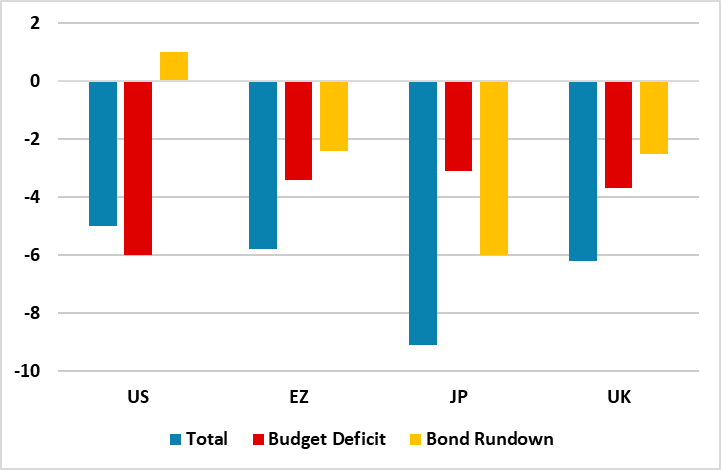
Source: IMF April 26 Fiscal Monitor/Continuum Economics
For 2yr Bunds, zooming out a moment, from a medium-term macro and technical perspective, the 2yr Schatz looks to have cemented itself into the bottom half of the old 2-4% band. The floor was re-tested and held prior to the Iran outbreak, providing some confirmation of the range shift. That yield zone prevailed in the last tech period from the late 90s; it was lost during to the post 2008 extended deflation escape period; and it has been abruptly regained with the reset fuelled by the Covid, Ukraine war and Trump shocks.
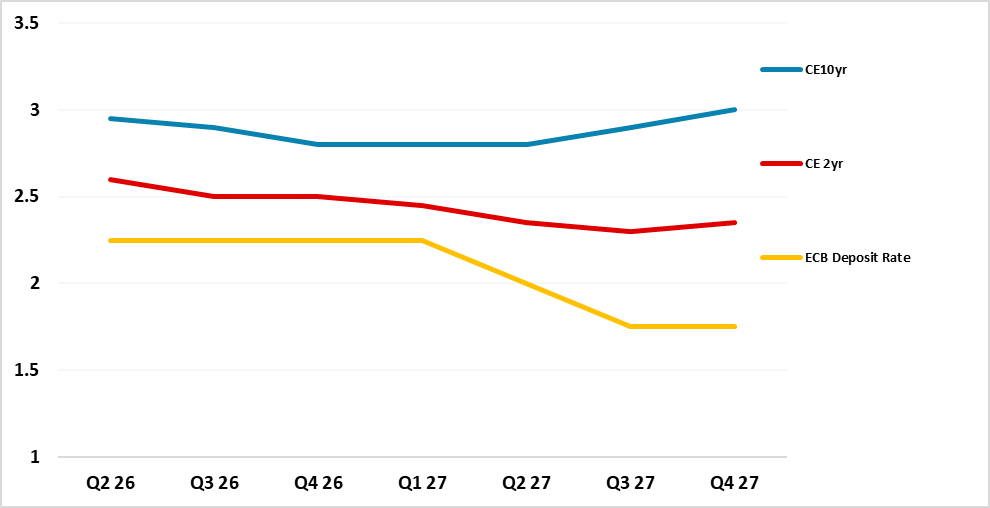
That is reflected in our central scenario, that is based on our relatively benign Iran trajectory continuing to play out. We look for the ECB to halt tightening (geopolitics allowing) this year and then more than reverse its precautionary 25bps hike in mid-2027 with a further 25bp cut to then shift policy more accommodative as the economy underperforms. But we expect that delayed easing when it arrives to be accompanied by some steepening in the short-end to the policy rate to limit any further 2yr yield downside to 2.3% (Figure 6). At the end of easing cycle, 2yr moves to a premium versus the ECB depo rate anticipating that the ECB could see a modest lift in the policy rate in 2028.
Figure 6: ECB Deposit Rate, 2 and 10yr Germany Forecasts (%)
Source: Continuum Economics
It’s a similar story further out the curve for 10yr Bunds. Absent any major global bond flow shock emanating out of Japan for example, we continue to expect the 10yr premium to remain contained. Indeed, Iran relief, and associated let up in pressures and inflation risk premiums, could see some further yield correction over coming months. On the charts, technicals even allow for bunds to pullback as low as 2.7% on this correction without changing the long-term structure, though we assume a more modest Iran-relief move to 2.8%. The curve would then revert to steepening as the ECB delivers the remainder of its delayed but mini easing cycle. We see 10yr Bunds at 2.8% end 2026 and 3.0% end 2027 (Figure 6). Heavier German issuance with the defence and infrastructure spending will underpin 10yr Bund yields, alongside ECB QT at 3% of GDP (Figure 5).
Risks around this scenario are two-way over the period. One scenario sees a much more persistent mark up in real yields coming through earlier and more persistently. This would be driven more by external US-led global capex and liquidity cycles, by wider fresh and redemption corporate bond issuance needs, by saving-investment swings and by perceived productivity. The opposite risk is a market timing one, unexpectedly hitting in the forecast window, centred on any eventual boom-bust correction in tech or other risk areas such as private credit/equity.
Figure 7: 10-2yr Germany to ECB Deposit Rate Inverted (%)
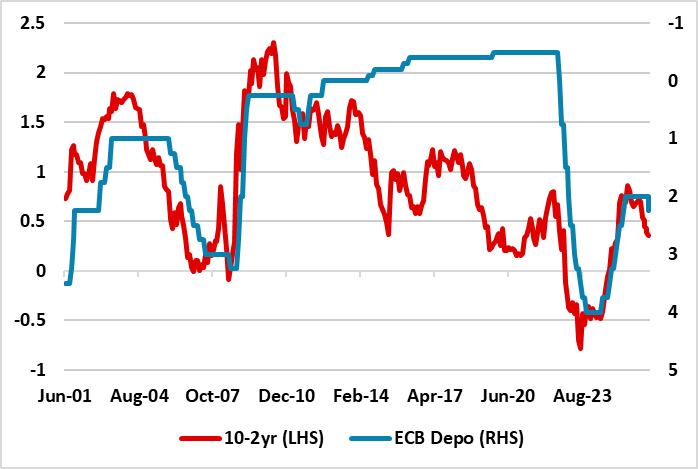
Source: Continuum Economics
In terms of wider Eurozone performance, the main risk factor over coming quarters in our view comes from France and the upcoming May 2027 presidential elections. While our central scenario is that the right-wing populist candidate does not ultimately win, pressure will remain on the fiscal position whatever the results as reforms remain politically blocked until at least the 2029 parliamentary elections. Japan has traditionally been a major holder of French debt and while it has already significantly divested and diversified, this fiscal development has also weakened stable base of OAT support in primary issuance and made the market more reliant on European institutional demand requiring higher yield compensation. In the current environment, focus remains on consensus and official expectations that France will fail to escape the excessive debt procedure (EDP) by 2029. In contrast, Italy remains on track to maintain its deficit cap, if currently significantly strained by global growth pressures, and has gained structural market confidence from its shift in operational focus to managing a binding expenditure path alongside maintaining a slight structural primary surplus. Minor spread ‘inversion’ to Italy could, at times, spread out to 10s having already been seen at shorter maturities. This could be 10bps below 10yr France.
Figure 8: 10, 2yr JGB and BOJ Policy Rate Forecasts (%)
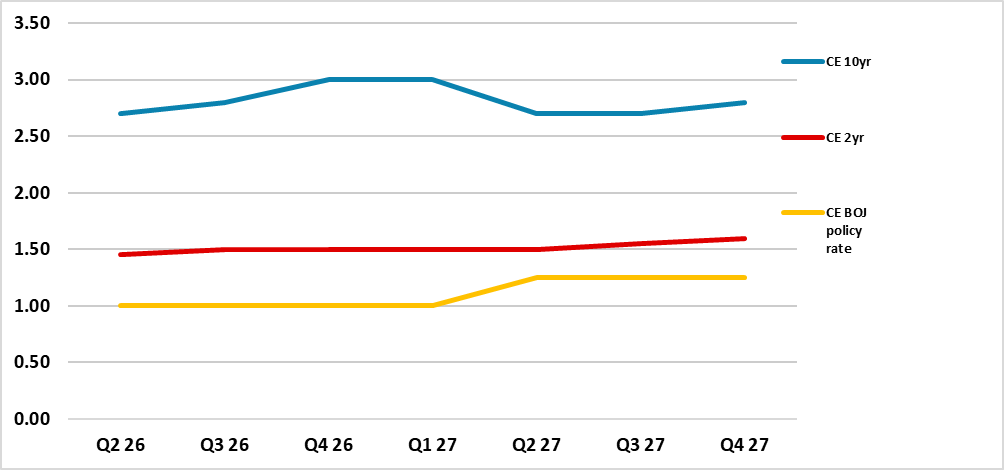
Source: Continuum Economics
In Japan, though the BOJ forward guidance is weak after the 25bps June hike to 1.00%, the multi-year normalization profile is still expected by the market. We see a 25bps hike in Q2 2027 to 1.25%, in the aftermath of a 2027 wage round that is likely to be consistent with 2% inflation. The BOJ neutral policy rate estimate of 1-2.5% means that expectations will linger of a 2028 hike all the way through 2027 and hence why we see a gently rising path for 2yr yields (Figure 8). However, we do not feel that the BOJ will speed up, as the U.S./Iran interim deal reduce 2027 inflation risks. We also feel Japanese consumers will be somewhat resistant to 2% inflation in the shops next year and this can slow consumption and then inflation. Thus we only see one 25bps hike in 2027.
Figure 9: 10-2yr JGB to BOJ Policy Rate Inverted (%)
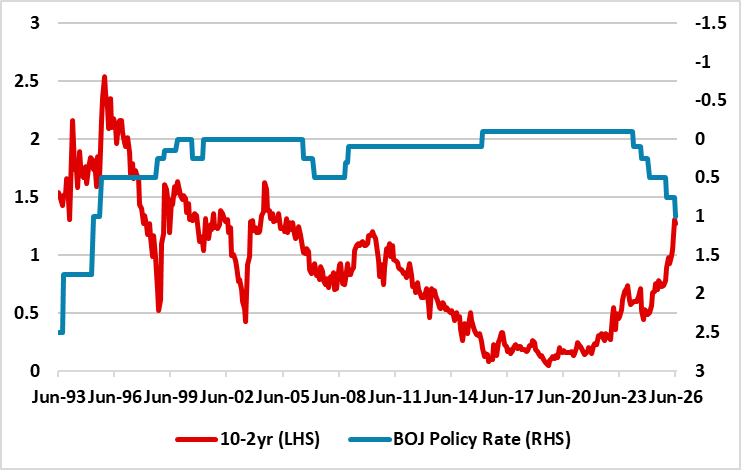
Source: Datastream/Continuum Economics
For 10yr yields, BOJ QT is more important than gradual BOJ policy rate normalization. Though the BOJ are keeping Y2trn pm gross bond buying, huge redemptions means that the BOJ is projecting its balance sheet to reduce materially by March 2030. The BOJ statement on QT (here) means that net QT is projected at 6.5% of GDP between April 2027-March 2028, then 6% in the 12 months to March 2029! With a modest budget deficit, this is a huge amount of debt for the rest of the market to absorb. This will require higher real yields and a still larger term premium. It is difficult to see 10yr yields below 2.5% and we feel a spike through 3.0% is a real prospect in the next 3-12 months. This could bring a small U turn from the BOJ via an increase in gross bond purchases, but we suspect it will not be aggressive. Net QT should be down to 2-3% per annum to avoid QT producing a steepening yield curve in a tightening cycle (Figure 9).
Figure 10: 10, 2yr Gilts and BOE Bank Rate Forecasts (%)
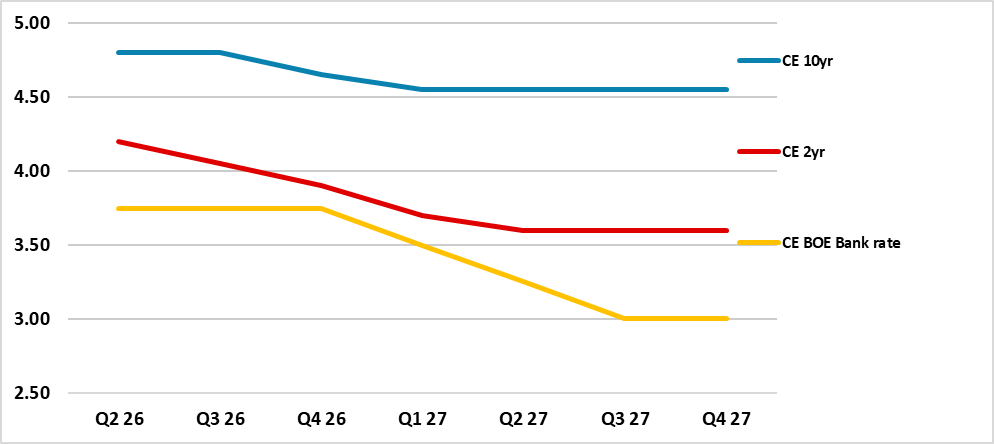
Source: Continuum Economics
For 2yr Gilts, the June decline in gas and oil prices, plus the U.S./Iran deal, means that the Iran war effect now is unlikely to produce major 2nd round effects. Indeed, underlying disinflation forces are growing with a weak labor market and soft domestic demand picture. This makes it more difficult to get a majority MPC vote in favor of a rate hike in 2026 (Figure 10). Additionally, the longer that the Straits of Hormuz reopens, the more the money market will likely give up on tightening fears. Indeed, by the autumn of this year we could start to see BOE easing hopes rebuilding for 2027. We see three BOE rate cuts to 3.00% in 2027 (Figure 10), with the first likely to help 2yr but the last likely to see the traditional swing from an easing cycle towards a future tightening cycle in 2028. Market estimates of the BOE neutral policy rate are wide, but are centered around 3.25-3.50%. Even so, the 2yr premium to the BOE policy rate will probably be in the 40-60bps region by end 2027 i.e. less than March-May rate fears.
For 10yr gilt yields, a potential change of Prime minister and Chancellor could mean a slight softening of fiscal rules, which can push yields back up. Even so, this is unlikely to deliver substantial new net fiscal easing in 2026-27 and fiscal worries should be lower after the autumn budget. Fiscal policy will thus continue to have mixed effects on the outlook over different years, but the wider economic/BOE policy picture will be more important. Into 2027, the focus will shift back towards BOE easing, which can help 10yr yields to decline. However, this will likely involve a steepening of the yield curve as traditionally happens (Figure 11). A slower pace of BOE QT will help on the margin, though we only see a reduction from GBP70bln to GBP50bln in the September 2026 BOE announcement – then around GBP30bln per annum from September 2027.
Figure 11: 10-2yr and BOE Bank Rate Inverted (%)
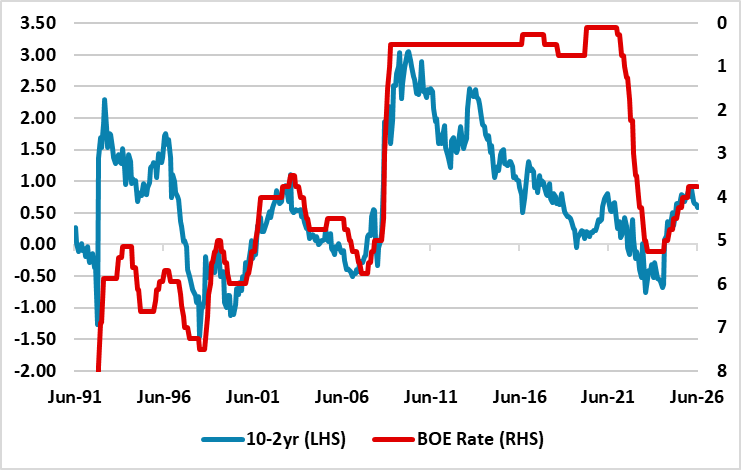
Source: Continuum Economics