Fed Tightening and U.S. Treasury Yields: 1994, 1999 and 2022 Redux
Our baseline involves no Fed hike, but 50-75bps is feasible in a plausible adverse scenario. In this alternative scenario of 50-75bps of Fed tightening it is easy to build the case for 2yr yields going to 4.30-4.40% area, before thoughts turn to H2 2027/28 involving modest Fed rate cuts. 10yr going inverted to 2yr as in 2022-23 appears unlikely however. The sense in 2026 is that real yields should be 2% or slightly above, given the U.S. government debt trajectory after fiscal easing since 2022 and the new era of more geopolitical tension/stretched supply chains/less globalisation and heavy AI and global defence financing. 1999 saw around a +20-35bps 10-2yr yield curve premia. Overall, current structural conditions, plus some reflection on previous history, could mean 4.50-5.00% 10yr U.S. yield in this alternative scenario for the Fed.
History is not always repeated, but should not be ignored. What does previous Fed tightening tell us about the risks for U.S. Treasuries?
Figure 1: Fed Funds, 2yr and 10yr U.S. Treasury Yields (%)
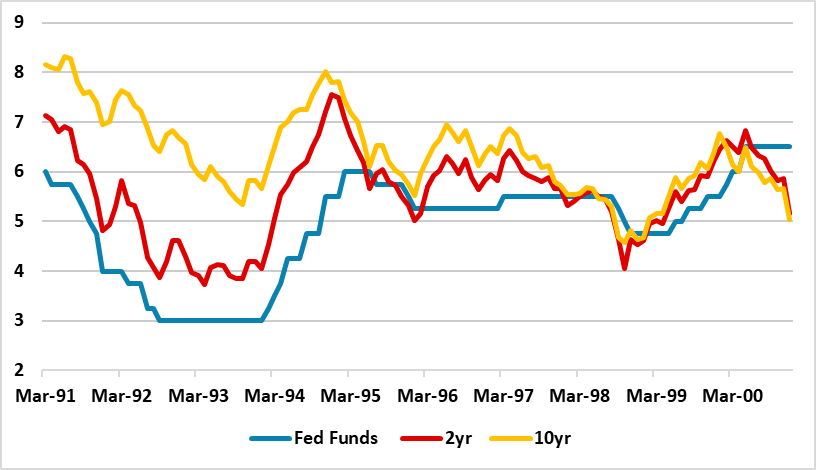
Source: Datastream/Continuum Economics
Our baseline view on the Fed has been guided by the view that a Straits of Hormuz deal would be reached by end July before the rundown of commercial and strategic oil inventories slows and oil prices come under upward pressure to destroy more demand. Under this view we would see the Fed on hold for the remainder of 2026. However, if the Straits of Hormuz is closed until the autumn then the U.S. could face a still greater and more sustained oil price shock, that could prompt Fed tightening. Indeed, the Fed could decide that the combination of demand inflation from the AI boom and supply inflation from existing energy prices/current underlying inflation trajectory prompts the Fed to tighten. This alternative scenario could be a 50bps to 75bps set of hikes through H2 2026/H1 2027, given that the policy rate is already above neutral. Does the 1994 and 1999 tightening cycles provide any clues for U.S. Treasuries in such a 2026 scenario?
Figure 1 shows that 2 and 10yr U.S. Treasury yields moved substantively higher in the 1994 bond market shock when the market was caught off guard by Fed tightening. The magnitude of the 1999 U.S. Treasury yield increase was less, as the starting point for tightening in 1999 at 4.75% was higher than the 1994 3% Fed Funds rate. 2022-23 provides some more modern history when the Fed moved through neutral to restrictive (Figure 2). 2yr yields led the Fed Funds rate until late 2022, but then went to a discount on the assumption that a 5.5% Fed Funds rate would be temporary. 10yr yields embraced this think even more, with the 10-2yr yield curve becoming more inverted. Even so, 10yr yields went up over 200bps in 1999 and over 250bps in 1994!
Figure 2: 2022-23 Through Neutral to Restrictive Policy (%)
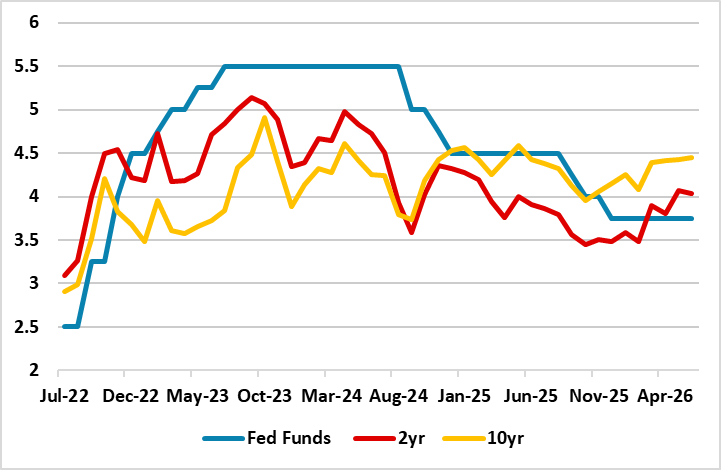
Source: Datastream/Continuum Economics
In the alternative scenario of 50-75bps of Fed tightening it is easy to build the case for 2yr yields going to 4.30-4.40% area, before thoughts turn to H2 2027/28 modest Fed rate cuts. 10yr going inverted to 2yr like 2022-23 appears unlikely however. In 2022-23, the market was adjusting to the end of ultra-low rates and a Fed tightening cycle driven by the Ukraine war and uncertainty over what the right real yield would be. The sense in 2026 is that real yields should be 2% or slightly above, given the U.S. government debt trajectory after fiscal easing since 2022 and the new era of more geopolitical tension/stretched supply chains/less globalisation and heavy AI and global defence financing. 1999 saw around a +20-35bps 10-2yr yield curve premia. Overall, current structural conditions, plus some reflection on previous history, could mean 4.50-5.00% 10yr U.S. yield in this alternative scenario for the Fed.