China: Echoes of Japan?
Overall, some of China’s private businesses and households are suffering from Japan’s style balance sheet recession. Combined with slowing productivity and a shrinking workforce, this points to slower trend growth in the coming years. However, fiscal stimulus and the clean-up of Local Government Financing Vehicle (LGFV) debt/banking sector equity capital injections have been quicker than they were in Japan. Additionally, China urbanisation and rise of GDP per capita is not yet finished, which will also provide some support for China’s growth in the coming years. Fresh fiscal stimulus is likely and we forecast GDP growth at 4.5% in 2026 and 4.0% in 2027 and very low positive inflation.
Figure 1: Japan Housing Starts Top Chart (1000’s) and China New Residential Floor Space Bottom Chart (Mln Sqms)
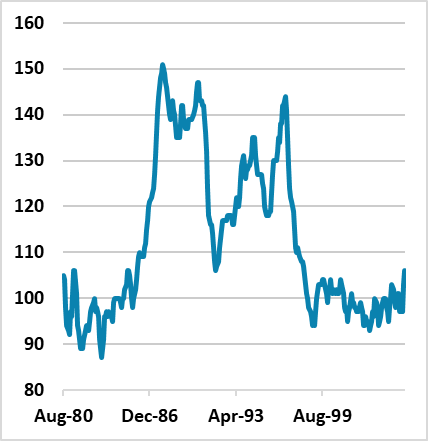
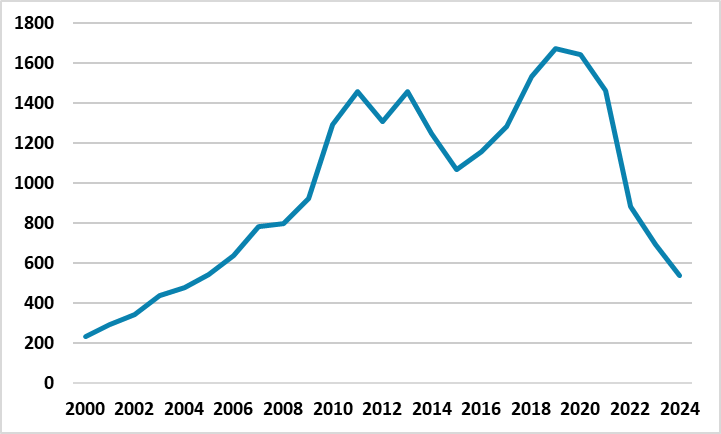
Source: Datastream/Continuum Economics
One persistent question is whether China is following Japan’s experience seen after the bubble burst in 1987-89. We have looked at the China vs. Japan debt issue in the past (here), but it is a topic that is worth revisiting. Some similarities exist, but also differences.
· China’s larger construction slowdown. The residential construction slowdown is greater in China than it was in Japan (Figure 1), as China has had years of excessive house building. This transition is not yet complete, with a lot of completed and uncompleted homes leaving an overhang of inventories that will still take years to work off. This will be a negative drag on GDP 2025-27, though in the order of 0.5-1.0% as China’s authorities policy measures produce an orderly adjustment. China’s house prices in tier 3 cities also remain at risk of multi-year downward adjustment, given still elevated house prices/earnings ratio.
· China tackles corporate debt quicker than Japan. The burst of the property bubble in Japan, plus a slowdown in growth, caused corporate debt deleveraging and defaults, which then cascaded into the banking sector and prolonged Japan crisis. China has announced Yuan10trn swap of LGFV and local government off balance debt for local government debt, which avoids defaults, sustains debt rollover, and lengthens maturities. This is a partial nationalisation of the LGFV problem. China’s corporate debt ex LGFV is more modest (Figure 2) and this also includes SOE debt, which China’s financial institutions rollover via moral suasion and financial repression – paid by low deposit rates for households. China has also been quick to inject extra equity capital into the banking system via Yuan500bln for the six largest banks to increase lending, whereas the Japanese authorities were slow until the 1998 banking crisis.
Figure 2: China LGFV debt to GDP (%)
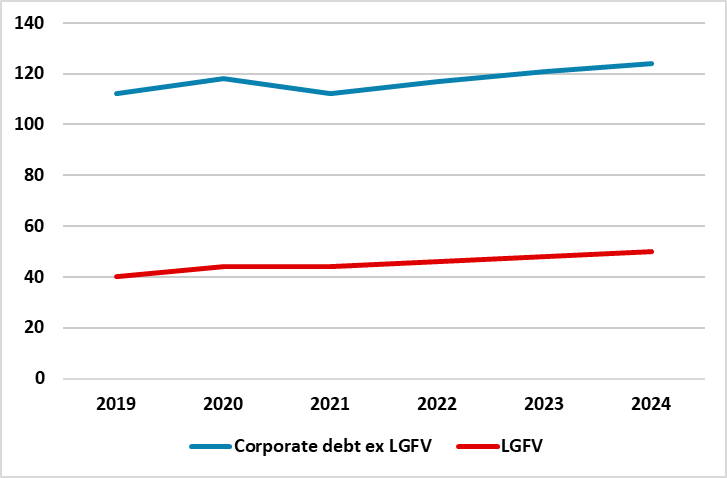
Source: IMF (here)/Continuum Economics
· Excess production to exports. China has followed Japan’s strategy of the late 1980’s/early 1990’s in meeting a slowdown in demand, with a redirection to exports. This has helped provide an underpinning for 2024 GDP growth. However, the U.S. now has a 30% tariff regime, while the EU and other countries are wary about China dumping goods on them. Though a U.S./China trade deal will likely get done (here), China will likely find it difficult to maintain a net export boost, which was also Japan’s experience after the lagged huge Plaza Accord-driven JPY appreciation kicked in.
Figure 3: China Monthly Exports and Imports (Yr/Yr %, 2mma)
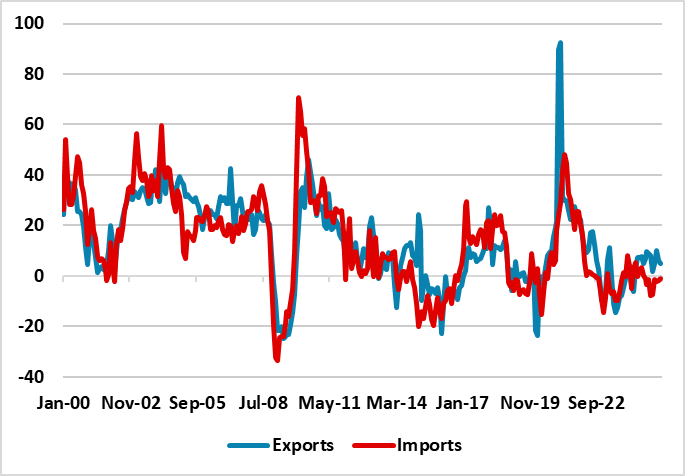
Source: Datastream/Continuum Economics
· Consumer does not pick up the slack. Household consumption has helped deliver 5% growth, but China is not undertaking a major transition from an export/investment to consumption model. Japan had a similar failure to transition the growth model. Even so, China’s consumption will be moderate, as China is still climbing the GDP per capita curve including more urbanization and consumption. In contrast, Japan already had high GDP per capita. However, China’s consumption is being held back by cyclical (e.g., adverse housing wealth/slowing employment growth) and structural factors (government reluctance to increase weak health/unemployment/pension safety nets).
· Japan’s deflation versus China’s disinflation. Japan’s CPI deflation is well documented, but the picture is more complex in China. Though the GDP deflator has seen small negative numbers in the last 9 quarters, we feel that this is due to the split of nominal GDP between real GDP and the deflator and a bias to boost the real GDP data. CPI inflation showing aggressive disinflation probably tells the current story. While China’s authorities are trying to reduce price wars in certain sectors e.g. autos, the excess of production versus domestic demand could still risk a persistent deflation phase – though this is not our baseline, where we look for very low positive inflation (here).
· Government stimulus. Though China’s Ministry of Finance budget deficit does not look too large, the IMF general government deficit is running at a much higher rate of 7-8% (Figure 4). Japan only got to very large budget deficits in 1998 and China has been quicker to use fiscal policy in recent years than the immediate post bubble period in Japan.
Figure 4: China General Government Deficit/GDP (%)
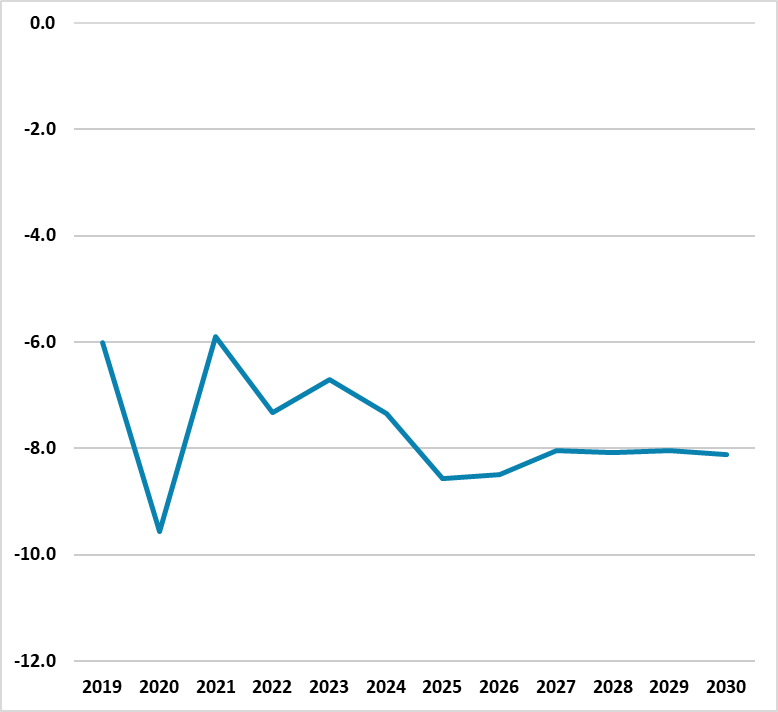
Source: IMF Fiscal Monitor April 2025/Continuum Economics
Overall, some of China’s private businesses and households are suffering from Japan’s style balance sheet recession. Combined with slowing productivity and a shrinking workforce, this points to slower trend growth in the coming years. However, fiscal stimulus and the clean up of LGFV debt/banking sector equity capital injections have been quick than they were in Japan. Additionally, China urbanisation and rise of GDP per capita is not yet finished, which will also provide some support for China’s growth in the coming years. Fresh fiscal stimulus is likely and we forecast GDP growth at 4.5% in 2026 and 4.0% in 2027 and very low positive inflation.