UK CPI Review: Fresh and Marked Fall Resumes as Core Slips to Cycle-Low?
Although most aspects of the January CPI came in a notch above BoE thinking, the clear fall in the headline rate and further looser labor market messages still point to a BoE rate cut next month, not least given the likely return to the 2% target by April. These projected falls started with these January numbers (Figure 1) where airfare distortions which pushed up the December outcome unwind, and where base effects helped reduce food inflation – albeit where PPI numbers also point to softer such price pressures. As a result, the headline CPI rate fell from December’s 3.4% to 3.0% (a 10-mth low). Services and the core rate fell both 0.1 ppt to 4.4% ad a new cycle low of 3.1% for the latter. Notably such declines have been signalled for some time by adjusted m/m data (Figure 2), with already-soft wage figures likely to result in lower underlying inflation ahead (Figure 3).
Figure 1: Headline Falls Clearly
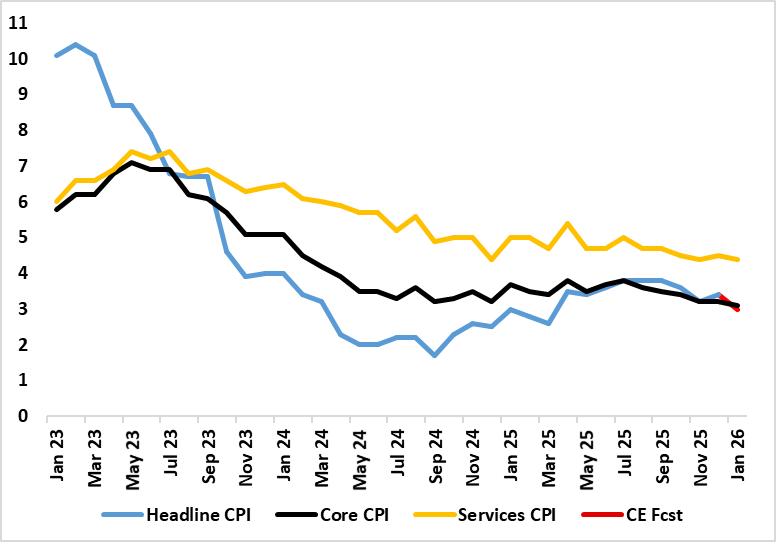
Source: ONS, Continuum Economics, % chg y/y
Admittedly, not all aspects of the CPI data are reassuring, with a further rise in catering services inflation, often seen as an indicator of price persistence given that the sector’s cost base is very much wage related. Even so, the evidence on this is mixed with HMRC pay data very clearly slowing as slowing in wage inflation for accommodation and food services. Regardless there are very clearly reassuring aspects most notable in even lower rental inflation which at just over 3% has more than halved in the last year, surely an added sign that the housing market is in the doldrums. There is also a further slowing in non-energy goods inflation which probably reflects both weak global demand and dumping of goods by China produce once destined for the U.S.
Although we have been flagging a fall in CPI headline inflation rate down to the 2% target sometime in the spring, this line of thinking is becoming more widespread, helped by some recent Budget measures. Notably the BoE is now suggesting that inflation will fall to 2.1% by April, partly reflecting base effects and largely stay there through Q2. We see a similar drop but (unlikely the BoE’s anticipated more modest drop) also that this will be accompanied by a fall in the core rate to just over 2% by mid-year.
Figure 2: Short-Term Core Inflation Consistent with Target for Some Time?
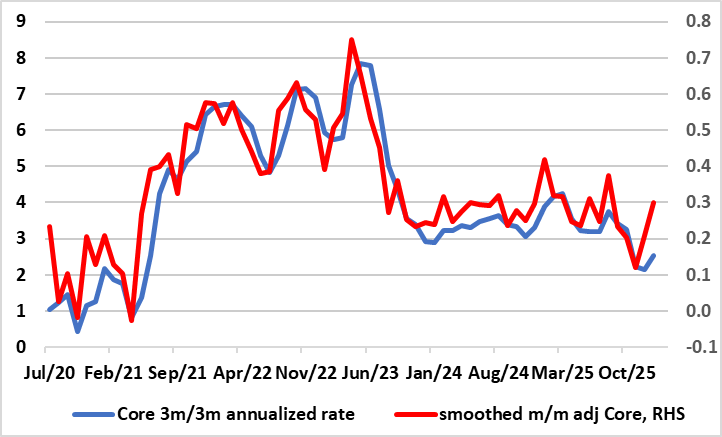
Source: ONS, Continuum Economics, % chg
Partly this reflects nothing more than an extension of what recent adjusted m/m data have been suggesting with core rates on this basis already consistent with the 2% target (Figure 2).
But secondly there is also the labor market backdrop. Elevated labour cost growth has been pushing up inflation, particularly for services which tend to be labour intensive. However, BoE analysis suggests that there is little evidence for their having been a structural change in the characteristics or size of wage-setting clusters in the UK economy – although Chief Economist Pill disagrees! Instead, the BoE suggests that the pandemic and the subsequent period of high inflation have not induced many UK firms to fundamentally change their approach to wage-setting. Admittedly, elevated labour cost growth has more clearly pushed up aspects of CPI inflation, particularly for services which tend to be labour intensive. However, while wage growth has fallen back significantly for reputational firms and incentive payers, it remains elevated for cost minimisers and bargaining employers. For the former, that can at least partly be explained by their large exposure to the national living wage, which has increased materially in recent years. For the latter, it probably reflects longer lags in bargaining employers’ responses to macroeconomic conditions in the face of large shocks.
Figure 3: Wage Pressures Already Consistent with CPI Target?
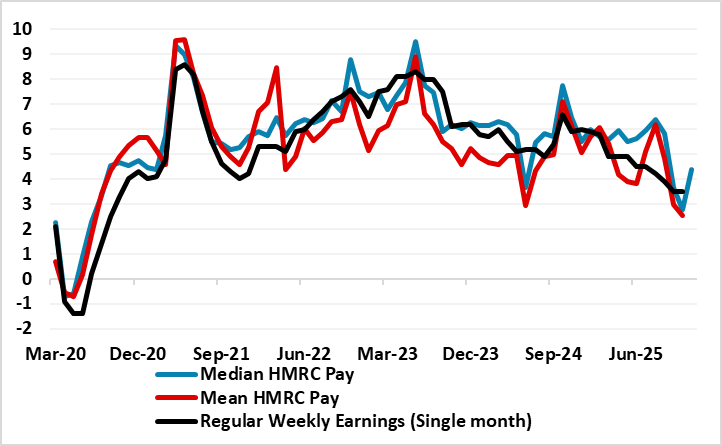
Source: ONS, Continuum Economics, % chg /y
But the BoE now suggest that wage growth of around 3-3.25% is consistent with the 2% CPI target, this assuming productivity growth of 1% per year. We think that wage inflation may already be around this rate as the latest labor market numbers highlight. Admittedly using ex-bonus private sector earrings data (which are not a pure wage measure as they are affected by overtime/hours worked too), such wage pressures are nearer 3% on an adjusted three-month annualised basis. But pay data from HMRC are even weaker, already showing wage readings running below 3% (Figure 3).
Such data should encourage further speculation that the BoE will ease afresh next month and that Bank Rate should even get down to 3.0% by year end; after all, in the weak demand/more spare capacity scenarios in the latest BoE Monetary Policy Report, Bank Rate is seen moving below 3%!