UK Labor Market: Continued Private Sector Job Losses Weighing More Clearly on Wages
There may be signs that the labor market is haemorrhaging jobs less clearly, if not actually indications that the more authoritative payrolls have stopped falling, albeit this largely due to increasing jobs within the health sector. Indeed, private sector payrolls are still falling, down almost a full ppt in y/y terms and more steeply so (Figure 1). Regardless, the latest labor market data (still bereft with reliability questions) are showing more comprehensive signs that the labor market is loosening with activity rates back to almost pre-pandemic levels. Partly as a result, the jobless rate has risen and, in tandem with the 39th consecutive month of falling vacancies, is very much showing that the ratio of the two has hit new highs, also consistent with a looser labor market (Figure 2). This helps explain the clear(er) signs of softer wage pressures with the growth rate of private sector regular pay down to the lowest since end-2021, also now undershooting BoE projections and where more short-term measures suggesting even weaker growth (Figure 3).
Figure 1: Private Sector Payrolls Still Falling- Clearly Too

Source: ONS, CE
There are still questions about the reliability of official jobs data, making a focus on the now full accredited HMRC payroll data all the more important. This gauge of employment excludes self-employment) and has been showing clear declines of late, albeit some revised away. However, while there signs that payroll weakness has ebbed this is almost solely a result of a further jump in public sector jobs, mainly in health but where fiscal holws suggest that this may go into reverse in the not too distant future. Indeed, public sector payrolls have risen almost full ppt in the last year, but where private sector payroll have not only fallen by the same amount but are falling more steeply (Figure 1). To what extent this reflects the on-going impact of recent tax changes (although the jobs declines are not concentrated in the more wage sensitive service sector) is unclear. But surveys very much suggest companies are at best freezing hiring and at worse laying staff off or not replacing, this latter development helping explain the fact that vacancies have fall in every month for over three years.
Figure 2: A Looser Labor Market Undermining Wage Pressures

Source: BoE, ONS, CE
This, alongside a further rise in activity (or participation) rates (back almost to pre-pandemic levels), has contributed to a rise in unemployment and a rise in the jobless to vacancies ratio – often seen as a better gauge for the labor market tightness. Indeed, this ratio has risen to there now being 2.4 unemployed for every vacancy – up by a third in the last year. But this data is probably understating labor market looseness as it is still reliant on official ONS data where survey response question reliability. Indeed, (Agents) survey data produced by the BoE very much suggest that labor looseness is more marked than the official data (Figure 2), actually back to levels below pre-pandemic averages (Figure 2). And it is this labor market loosening that probably explains the fall in wage pressures – at least in the private sector (base effects have pushed up in public sector wage earnings data – temporarily!
Figure 3: Private Sector Pay Growth - Falling Fast

Source: ONS, CE
Indeed. at 4.4%, private sector regular pay has fallen to the lowest since enbd-2021, also now undershooting BoE projections and where more short-term measures are suggesting even weaker growth. In fact, the three-month annualized data actually suggest an undershoot of BoE thinking for the end of the year, ie of 3.7% (Figure 3), a slowing which matches an increasing array of business survey data – the latest numbers from the REC suggest the weakest growth in starting pay in over four years. Notably, the payroll data very much suggest that it is in the sectors which have seen the highest pay in the last year that job haemorrhaging is clearest, the exception being the recent large scale pay wards to the public sector – which will not be repeated in the foreseeable future
Figure 4: Higher Private Sector Pay Growth Associate with Clearest Job Losses
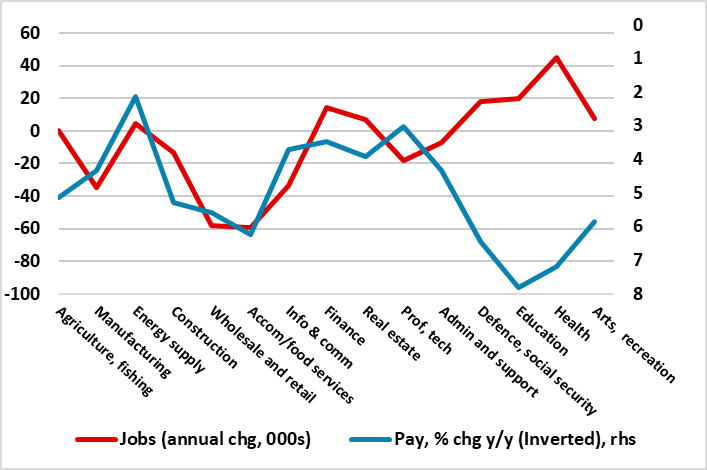
Source: ONS, CE
The slowing in pay that the BoE hawks have almost dismissed may not be so elusive after all!
I,Andrew Wroblewski, the Senior Economist Western Europe declare that the views expressed herein are mine and are clear, fair and not misleading at the time of publication. They have not been influenced by any relationship, either a personal relationship of mine or a relationship of the firm, to any entity described or referred to herein nor to any client of Continuum Economics nor has any inducement been received in relation to those views. I further declare that in the preparation and publication of this report I have at all times followed all relevant Continuum Economics compliance protocols including those reasonably seeking to prevent the receipt or misuse of material non-public information.