UK CPI Preview (Jan 15): More Mixed Inflation Signals
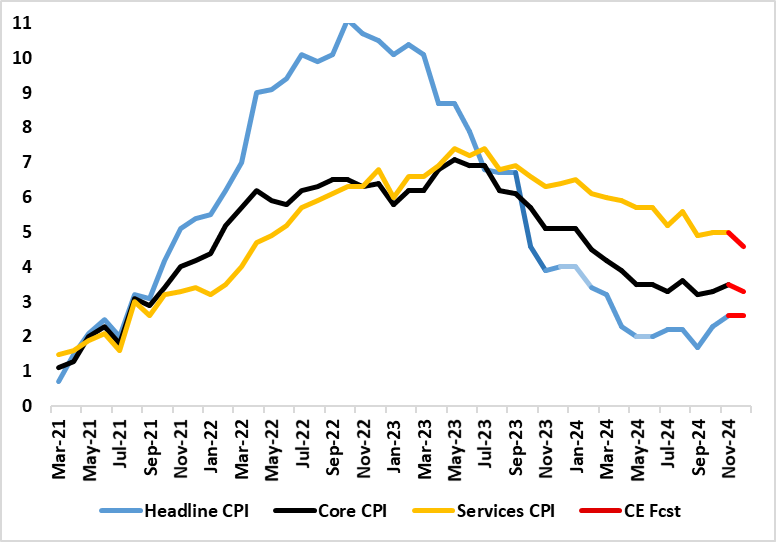
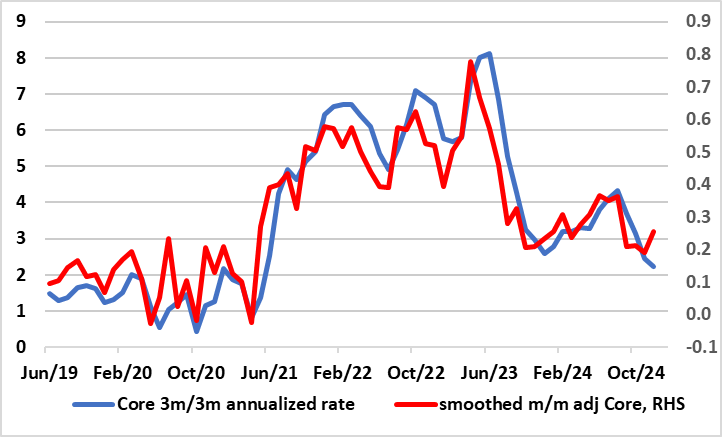
Amid current bond market ructions, which some are suggesting reflects stagflation worries, we think that looming December UK CPI data may help dispel some of the inflation aspect of those concerns. Admittedly, markets are looking for the headline rate to nudge up a notch, although we look for a stable 2.6% outcome and with downside risks towards BoE thinking of a 2.5% figure. But the December figure will be driven by higher petrol costs and the headline may mask a drop in both the core and services inflation of around 0.2-0.4 ppt (Figure 1), thereby providing a more reassuring message than the November data. Indeed, exceeding both our and BoE thinking, November CPI inflation jumped 0.3 ppt to 2.6%, actually an eight month high, and where services inflation remained at 5.0% while the core rose 0.2 ppt to 3.5%, also exceeding Bank projections. However, looking at the CPI details, adjusted data still painted a much softer picture than base-effected y/y numbers and may do likewise in the upcoming figures(Figure 2).
Figure 1: Divergent Inflation Picture?

Source: ONS, Continuum Economics
Those November CPI data came after more cost pressure worries were fanned by earnings data in the latest labor market numbers. But those numbers also showed clear(er) signs of falling employment and those payroll figures also questioned whether wage growth has indeed picked up. As a result, the figure do sit more easily with the ‘stag’ part of a stagflation picture as do the most recent business survey numbers. Indeed, it is clear is that the economy is stagnating, and that this predates the Budget, very much asking to what degree it is BoE policy that is hindering activity principally.
The Recent Inflation Picture – More Benign in the Details?
As for recent inflation, coming in as largely expected and above BoE thinking, CPI inflation jumped to 2.6% in October, partly due a swing in fuel costs, amplified by base effects. The data also showed a fresh rise (of 0.2 ppt) in both the core inflation to 3.5% and it noteworthy that nine of the 12 CPI components picked up. Nevertheless, the CPI data backdrop is still consistent with underlying inflation still having fallen, especially when assessed in shorter-term dynamics (Figure 2) something that was repeated in those November data and will again be seen we think in the December numbers.
Figure 2: Clear Adjusted Core Inflation Drop Continues?

Source: ONS, Continuum Economics