EZ Bilateral Trade Nuances with the U.S. – Its Imports Not Exports
As the EU/EZ prepares for an almost certain trade spat if not trade war with the U.S. as the latter levies well-flagged and probably significant tariffs, we consider what is actually behind President Trump’s ferocity regarding bilateral trade. As has been suggested widely, the EZ does not actually have a trade gap of any serious proportion with the U.S. certainly once services are taken in to account. Indeed, the bilateral current account was in deficit with the U.S for a period recently (Figure 1). Admittedly, that has now turned into a surplus as the goods trade balance improved. But the point we would underline is that this is unlikely to be repaired or even addressed by tariffs as this goods trade reflects weakness (Figure 2) in EZ real domestic demand (which tariffs may only extend if not accentuate) which has reined in imports and it is the weakness in the latter (Figure 3) which is responsible for the rising trade surplus in goods in recent years.
Figure 1: Bilateral Current Account Gap with U.S. Barely Visible
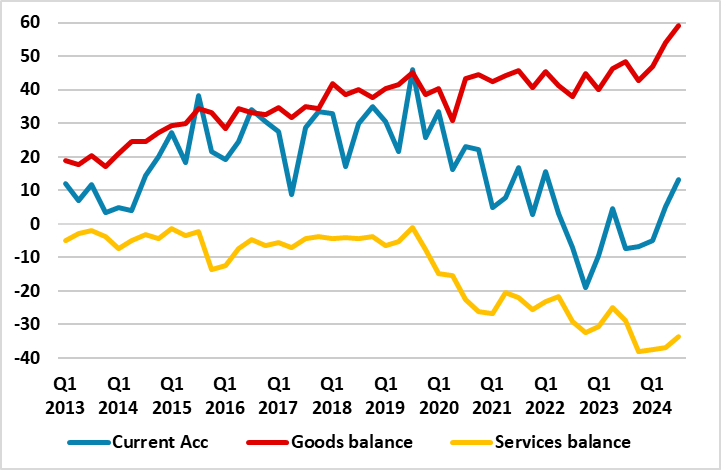
Source: ECB, EUR Billion in trade between EZ and U.S.
But less well known is that this fresh nominal rise in the bilateral gap as opposed to real goods surplus improvement (which is the issue perturbing Trump) has as much actually been driven by price shifts in the last few years not volumes, this including the appreciation of the USD (Figure 4), and the fall in energy prices both oil (Figure 5) and gas.
What’s Coming
On March 12, the U.S has flagged a 25% global tariff on steel and aluminium imports. In early April, the so-called “reciprocal” tariffs will apparently be unveiled. As for the EU and the EZ (both institutions that Trump has great disdain for) are threatened with a 25% tariffs on their exports, which may or may not be the “reciprocal” ones. The damage to the EU will be fairly significant even though EZ exports of goods to the US were only 3% of its GDP in 2023, especially given what may be termed as second round effects as other countries attempt to shift their exports from the U.S. to Europe, and already-frail EZ business confidence is hit by the added and extended uncertainties.
Figure 2: Weak EZ Domestic Economy Has Reined in Overall Imports
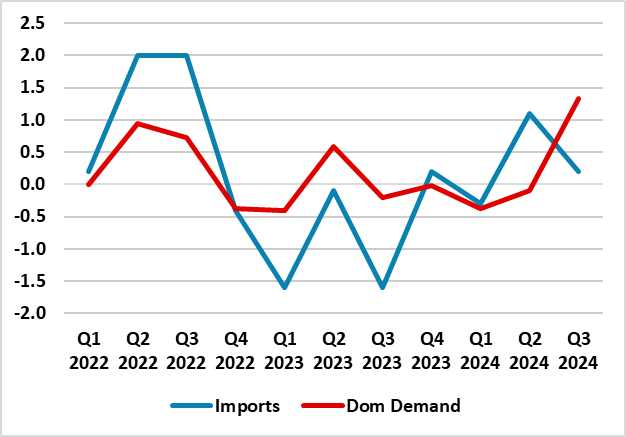
Source: Eurostat, % chg q/q
Import Weakness Parky Demand Determined…
This weakness in confidence also reflects weak EZ domestic activity, this very much having been masked in overall GDP terms (ie no serious conventional recession) by weakness in imports (Figure 2). But while there are some signs that real imports are starting to recover, the opposite seems to be the case as far as nominal imports are concerned at least as far as those emanating from the U.S. Indeed, the fact that the bilateral trade in goods gap with the US has started to rise is very much due to a fall back in EZ imports from the U.S. rather than increased EZ exports to the latter (Figure 3).
Figure 3: Trade in Goods Gap with the U.S. Widening due to Import Drop Not Export Rebound
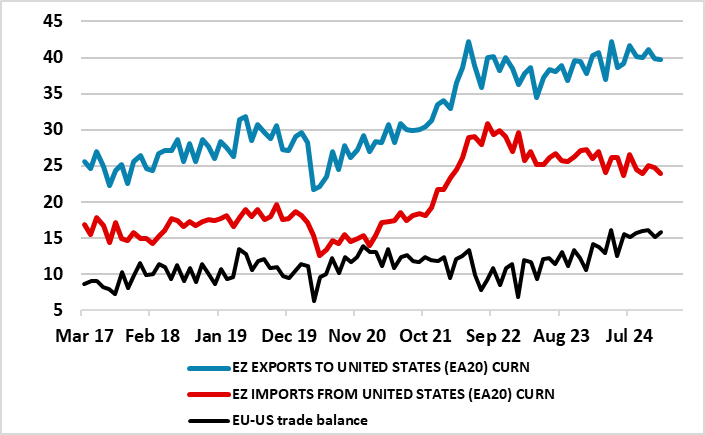
Source Eurostat, ECB, EUR Billion
… But Also due to Swings in Prices
As importantly, much if this is being driven by shifts in prices. This includes the EUR/USD exchange rate. During the immediate recovery from the pandemic, the appreciation oi n the USD helped boost the cost to the EZ of purchases from the U.S. But more recently, the fall back in the USD has done the reverse, helping curb the nominal value of EZ imports (Figure 4).
Figure 4: Less Strong Dollar Reduces EZ Import Bill
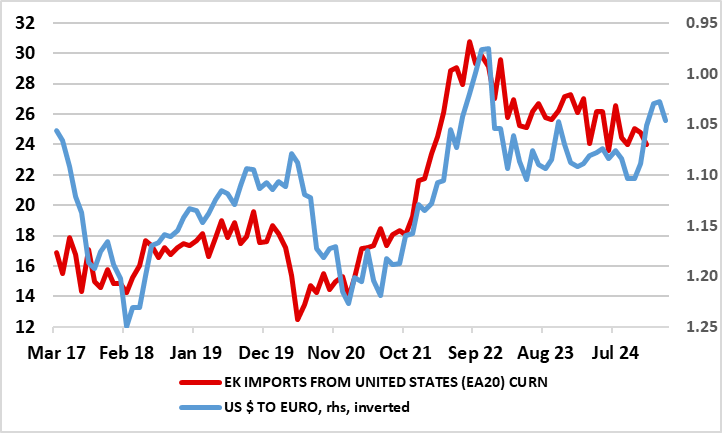
Source; Eurostat
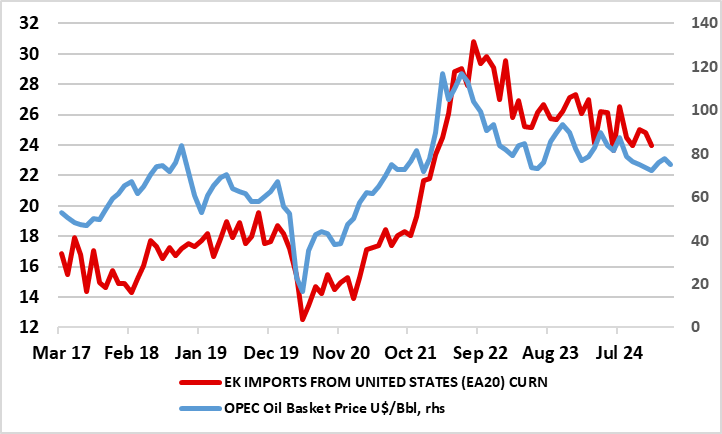
This has come in spite of what have been marked rise in the volumes of certain EZ imports from the U.S. most notably oil and gas which are first and third in terms of goods most imported by the EZ /EU from the U.S. Most notable in this has been the surge in LNG imports from the U.S. In 2023, the EU imported over 120 billion cubic meters of LNG with the U.S. now being the largest LNG supplier to the EU, representing almost 50% of total LNG imports, this having tripled since 2021 as the EU shifted away from unstable Russian supplies. Similar concerns also mean that the U.S. became the EU's largest oil supplier after Russia's invasion of Ukraine in February 2022 disrupted Europe's energy supplies. But the 15.1% of the EU's petroleum oil imports that came from the US in Q3 last year was down some two ppt on the previous year as lower oil prices reduced the bill (Figure 5. This is even more notable for LNG where the marked drop in price reduced the import bill by around half in 2023 to EUR 30 bln.
Figure 5: Falling Energy Prices Also Reducing EZ Import Bill
Source: Eurostat, EUR billion
Admittedly, the EZ’s imports from the US may rise further this year as a result of increased purchases of gas (not least to restock depleted inventories) and increased military spending, both also attempts to pacify Trump. A faster recovery may also help if fiscal promise bear fruit. But the irony is that two of Trump’s economic aims (lower oil prices and weaker USD) may serve only to widen the goods gap with the US
.