UK CPI Inflation Preview (Jan17): Headline and Core Are Adjusting?
Superimposed over both upside and downside surprises, UK headline and core inflation have been on a clear downward trajectory in the last few months the former having peaked above 10% in February and the latter at 7.1% In May. Very much this trend continued in November down markedly to a 27-month low of 3.9% but where the core slid lower by a further 0.6 ppt to 5.1%, a 23-month low. In the looming December CPI figures we see both slipping further but by only 0.1 ppt for each (Figure 1) but with both downside risks for the later and where more disinflation signs may be evident in the accompanying PPI numbers.
Nevertheless, we note these anticipated outcomes are well below BoE projections unveiled in November, which reflects in a) the short-term; softer food and non-industrial good inflation and b) in the medium-term; less of the upgraded price risk the BoE added to its November MPR. Moreover, our estimates of seasonally adjusted data (Figure 2) add to the signs of clear disinflation trend very much continuing, albeit not intensifying as far as core numbers are concerned but with circa-zero outcomes for the headline of late. The CPI data are soft enough to swing BoE worries away from wages as it assesses persistent price pressures but where even wages may be showing a similarly sizeable slowing, especially if also presented on such an adjusted m/m basis.
Figure 1: Further But Smaller Fall in in Headline and Core Inflation Beckons
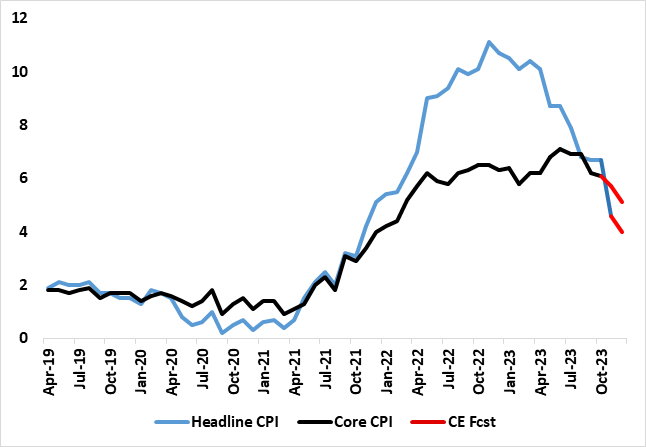
Source: ONS, Continuum Economics
The government has made much of the fact that CPI inflation slowed to 4.6% y/y in October 2023, down from 6.7% in September and thus has more than halved from its peak of over 11% a year ago. The drop has little to do with government action, the very opposite. Instead, both supply (we think predominantly) and demand (to a lesser extent) factors are reining in price and cost pressures and more broadly so.
As for the latest numbers, CPI inflation slowed to 3.9% in the 12 months to November 2023, down from 4.6% in October. The largest downward contributions to the monthly change in both CPIH and Core CPI (excluding energy, food, alcohol and tobacco) rose by 5.1% in the 12 months to November 2023, down from 5.7% in October; the CPI goods annual rate slowed from 2.9% to 2.0%, while the CPI services annual rate eased from 6.6% to 6.3%. Notably food inflation fell into single digit territory while restaurant inflation (often cited as an in indicator of persistent price pressures slowed to 5.3%, down over a ppt.
Figure 2: Adjusted Headline CPI Pressures Near Zero?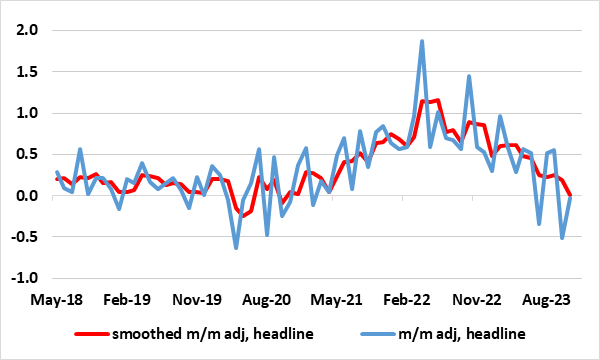
Source: ONS, Continuum Economics
All of this is likely to reassure the BoE. The Bank may be calmed as various alternative y/y measures of core and underlying inflation have started to fall and where seasonally adjusted core prices eased further in October. However, recent months suggest that this slowing in core adjusted inflation has not intensified, instead with recent underlying inflation remaining close to target on a smoothed m/m adjusted basis. But headline inflation is now running near zero on this adjusted basis (Figure 2). Regardless, it may be that downside economy risks are now taking precedence for the MPC majority but where some on the MPC want to see more convincing evidence that wage inflation is abating. The problem here is that the official data on labor market issues is still far from authoritative but we has argued that even the official earnings data are showing much softer signs, especially if also presented on an adjusted m/m basis.