UK: Much Softer Wage Signs May Already be (Increasingly) Evident?
While quite content to assess real economy matters via data presented on a q/q or even m/m basis, DM central bankers seem unwilling to evaluate inflation signals on just about anything but y/y numbers. This is particularly the case in the UK where the BoE’s focus on y/y rates means they are both slaves to what may be aberrant base effects and less able to pinpoint short-term turning points. We have frequently highlighted that seasonally adjusted m/m CPI data are offering a much more benign inflation backdrop. But, as we highlight below, officially computed seasonally adjusted - but m/m presented - earnings data also offer a very much more benign cost picture than y/y numbers (Figure 1) with every likelihood that this may trigger a fresh dose of downward pressure on CPI inflation. Surely, this is likely to temper what is clearly at the core of the BoE’s worries about inflation persistence.
Figure 1: A Stark Contrast - Adjusted m/m Earnings vs y/y Data
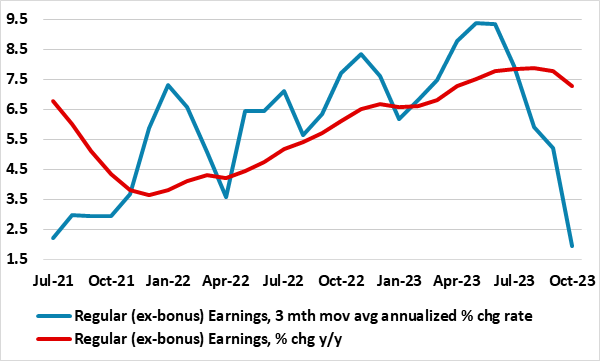
Source: ONS, all seasonally adjusted
Assessing Persistent Price and Cost Pressures
There have been inflation signs of late to reassure the BoE. The Bank may be calmed as various alternative y/y measures of core and underlying inflation have started to fall and where seasonally adjusted core prices eased further in October. However, recent months suggest that this slowing in core m/m adjusted inflation has not intensified, instead with recent underlying inflation remaining close to target on a smoothed m/m adjusted basis. Regardless, it may be that downside economy risks are now taking precedence for the MPC majority but where some on the MPC want to see more convincing evidence that wage inflation is abating, possibly anticipating that the weaker economic outlook will reinforce disinflationary signals, particularly on wages.
A Weaker Real Economy Picture…
As for a weaker economic outlook, the backdrop is looking softer too. Recent GDP sectorial updates suggest a much weaker growth picture for Q2 and Q3 last year, meaning that the 2023 average rate may be no higher than 0.2%, less than half the consensus and with this downgrade threatening an outright contraction for this year: we now see a 0.1% drop.
…Spilling Over into Wages?
While this projection and backdrop do argue in favor of wage disinflation, the problem here is that the official data on labor market issues is still far from authoritative. In terms of the main earnings data in the official labor market survey compiled by the ONS, even the BoE has admitted that its apparent resilience and strength does not chime with the emerging messages from survey data and/or alternative official data as that provided by the HMRC, the latter suggesting a softening and clearer downtrend albeit still mainly on a y/y basis: m/m figures are too volatile to be useful. But there is actual ONS data offering a clear indication of wage and salaries and which is available not only in y/y terms but also on a q/q basis, thus offering a more up-to-date insight into pay trends than that provided by mere y/y numbers. These are in the same national account data as seen in those GDP updates and cover household incomes. These do show seasonally adjusted wage and salary growth of 1.7% q/q in Q3 last year, still high historically but the second lowest outcome in almost three years. Moreover, these are numbers that largely chime with the official seasonally adjusted earnings data when the latter is also presented on an adjusted q/q basis (Figure 2).
Figure 2: Wage Data - Two Sides of the Same Coin?
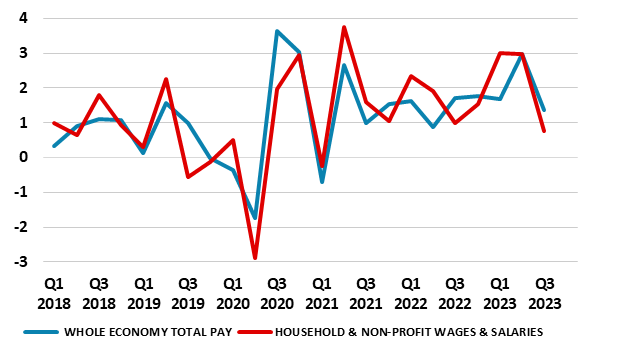
Source: ONS, CE, % chg q/q
Indeed, this also suggests that the earnings data may be considered to be statistically significant at much shorter periods than the usual y/y rates they are usually presented at. All of which begs the question, could we garner more insight from looking at even shorter periods for the earnings data as the latter are available on a monthly basis that already provide insights into the last quarter. There is problem here as the monthly sample size is consider to be too small for any one month to be statistically significant – hence why the earnings data are presented mainly on a three-month rolling average basis.
Figure 3: Adjusted m/m Earnings Slowing Markedly?
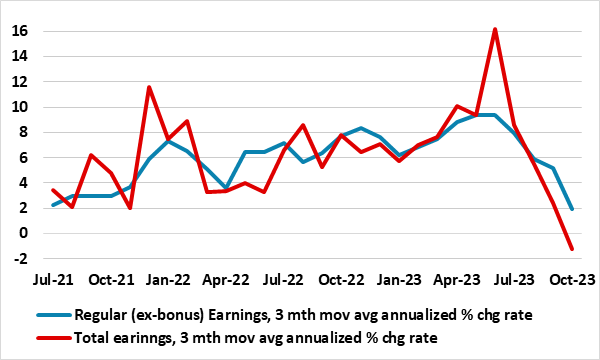
Source: ONS, all seasonally adjusted
But to overcome this glitch, we can compute and compile m/m seasonally adjusted data also on a three-month rolling basis. The results are startling. As shown in Figure 1, the three-month m/m adjusted data are showing a much clear slow-down in pay trends than the y/y numbers, this evident in what are deemed to be regular pay, ie excluding bonuses as the latter can be volatile. But it can be argued that bonus pay should not be ignored as these figures often (and understandably) herald slowing in regular pay. Figure 3 shows both regular and overall earnings growth, both underscoring a meaningful slowing in wage pressures. As we have underscored above the ONS-compiled earrings data still have shortcomings. But if they are overstating actual wage pressures, then the underlying wage picture may be slowing fast and furiously. As a result, while there may be signs that core m/m adjusted CPI inflation may have stopped falling, a fresh wind of disinflation may be emerging from the labor market - BoE take note!