UK GDP Review: GDP Overstating Activity Less Clearly But Looking Weaker?
After two successive upside surprises, a correction back in monthly GDP could be expected for the April data, especially as Q1 numbers may have been boosted by added production destined for the U.S in anticipation of tariffs. In addition, real estate activity seems to have dropped after the raising of effective stamp duty. But we already know that retail sales rose clearly in the month probably boosted by record sunshine and temperatures during April, although this probably caused the sharp fall in utility output. As a result, April GDP dropped 0.3% m/m, more than unwinding March’s 0.2% rise, thereby continuing the volatility of recent months. We think that GDP will be flat to down a notch in q/q terms this quarter and may be as weal in Q3, the former undershooting BoE thinking by a notch and even more so next quarter. Such weakness chimes with business surveys, payrolls and tax outcomes. If this pattern persists (let alone if it is even worse (Figure 1), then the BoE relative complacency regarding the economy is likely to shift.
Figure 1: Actual GDP Outlook - Alternatives
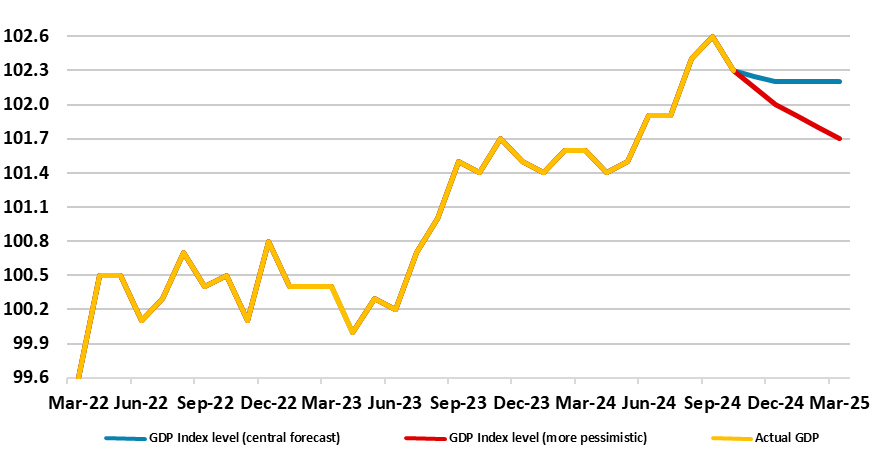
Source: ONS, CE
Perhaps more notably and something policy makers should bear in mind, the data volatility of late suggest what may be changing seasonal factors post pandemic which may mean the UK economy in early 2025 is seeing similar but short-lived strong growth as seen in in the same period of last year – thus any solid Q1 gain needs to be put into that perspective. But even amid a BoE view of near zero growth envisaged this quarter, we think the Bank is too optimistic about both the current state of the economy and the medium-term outlook, not least as it as its 1.5% average consumer spending n forecast for 2025-26 does not seem to have taken any toll from the higher inflation it has pointed to. And of course there is the global trade uncertainty which is going to hit continental Europe possible a protracted basis. Against this backdrop, it not surprising how negative business surveys are now flagging the activity outlook (Figure 2). Indeed, business survey data suggested an even weaker picture than the BoE, albeit PMI numbers less downbeat than numbers emanating from the CBI, whose survey numbers are somewhat more broad-based than the former’s high-profile composite index. But the PMI also tell a weaker story once its construction survey is included! With this in mind, we envisage near-zero Q2 and Q3 GDP growth and only around 1% for the whole of 2025.
Figure 2: Official Data Momentum Contrasts with Downside Risks From Surveys?
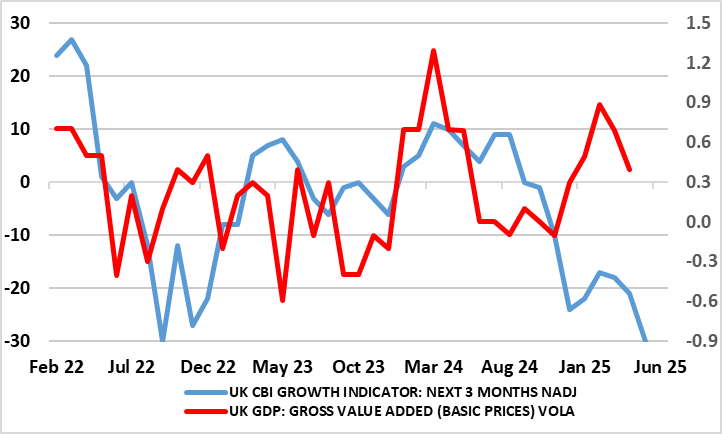
Source: ONS, CBI Growth Indictor which combines results from three separate sector surveys