UK CPI Preview (Oct 22): A Final Peak?
After the upside (and broad) June CPI surprise, CPI inflation rose further, up another 0.2 ppt to 3.8% in July, higher than the consensus but matching BoE thinking. Despite adverse rounding and fuel (and food) costs, the headline stayed there in the August figure, this foreshadowing a likely rise this month to what we (and the BoE think) will be the inflation peak in September of up to 4.0%, although we think food prices may slow, allowing a peak of 3.9% instead, this rise largely due to fuel. The September data is likely to see the core rate retain the August drop of 0.2 ppt to three-month low of 3.6% (Figure 1). After some further aberrant factors, the rate in August saw services inflation reverse the rise to 5.0% in July, back down to 4.7% and may edge higher due to airfares. Notably, in adjusted terms of late (Figure 2), with the recent rise in headline inflation driven more by goods but where core inflation on this basis is running well below what y/y rates would suggest (Figure 3). Food price pressures may abate soon too (Figure 4).
Figure 1: Headline to Nudge Higher Still, Core Stable?
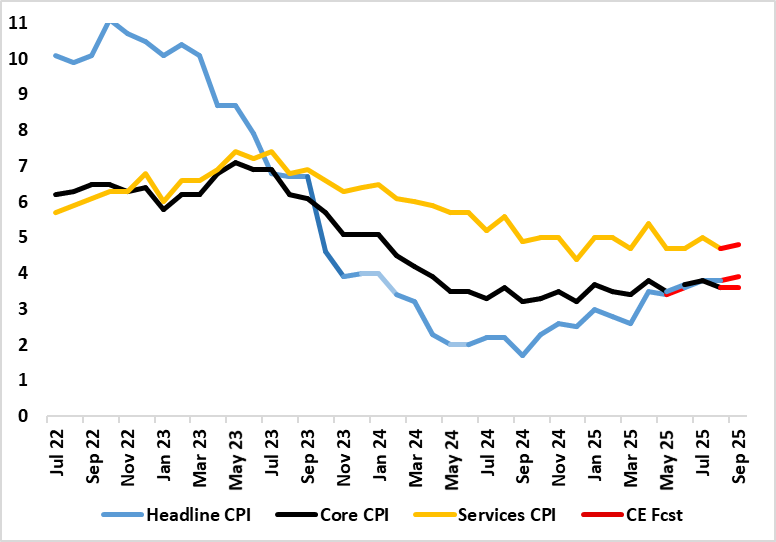
Source: ONS, Continuum Economics
The July and now August CPI headline are the highest since January last year. The notable further 0.3 ppt rise in services inflation to 5.0% was also largely in line with BoE thinking, but reflected several special factors (airfares) as does the fall back last time around, albeit where the same factors may cause a small rise afresh in September. The August numbers saw a further rise in restaurants inflation possibly a result of tax-induced labor costs feeding through, but if even so, the inflation rise in the last 2-3 months is far from broad as it reflected upward contributions from six (of 12) divisions, partially offset by downward contributions from six divisions, but where some BoE hawks will deduce signs of inflation persistence.
Figure 2: Inflation Boosted by Goods, Not Services?
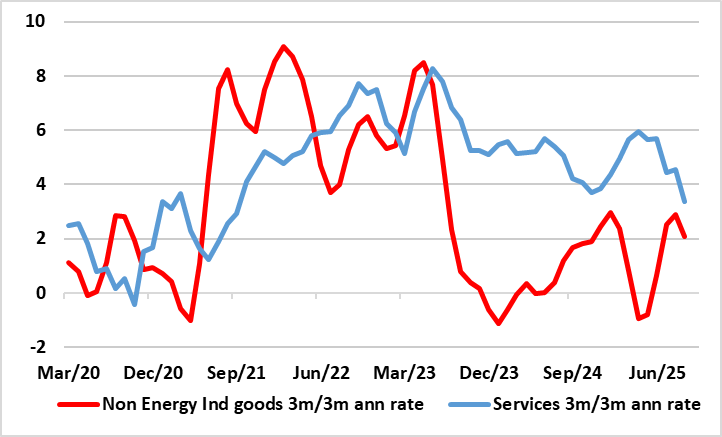
Source: ONS, Continuum Economics
In fact, while all the media and policy attention has been apparently stubborn services inflation, the latter has been easing, this more discernible in m/m adjusted terms, with the recent rise in headline inflation driven more by goods. Notably, while relatively broad, goods inflation has been pushed higher largely by food and energy, neither of which seem to be demand driven. Particularly in the UK rising food price inflation is both helping shore up well-above target CPI inflation and thereby deterring the BoE from what we think is well-warranted further monetary easing.
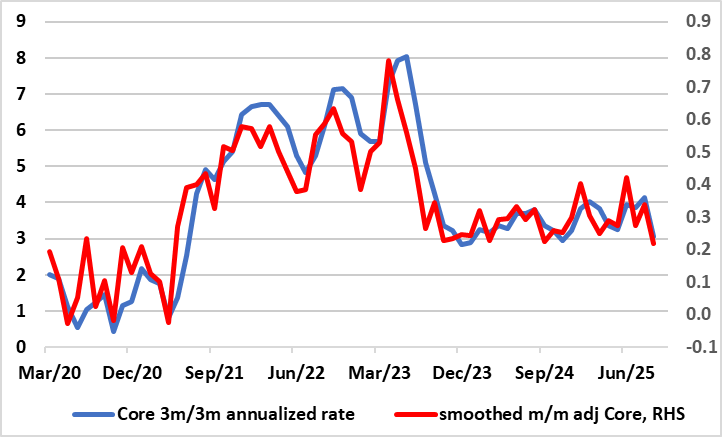
Figure 3: Clear Adjusted Core Inflation Drop Continues?
Source: ONS, Continuum Economics
But contrary to many suggestions, not least in the UK, high(er) food price inflation us not unique to the UK, it being very much something evident in the likes of Norway and Sweden and even some EZ economies – especially those furthest east ad further west where energy and weather factors have been a major factor. Thus suggestions from the UK food industry which says domestic policies, not global pressures, are forcing grocery bills higher are not supported by the evidence. While it is true that wage and employment costs increases, new regulations and a backed-up planning system are among the factors driving up grocery bills, weather and energy are more important. The outlook is very uncertain in this regard although we do note that global food pressures have started to ease back according to UN FAO monthly data (Figure 4).
Figure 4: Global Food Price Pressures Receding?
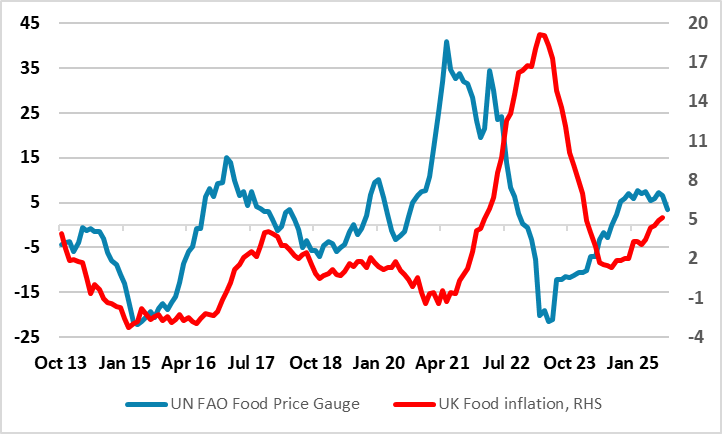
Source: UN FAO, ONS, Continuum Economics
But the main downside factor for the economy is the ailing labor market, data for which appeared earlier today; they showed softer wage numbers but with the (now officially accredited) HMRC showing continued job losses in the private sector, thus very much a reaction to previous wage pressures!
I,Andrew Wroblewski, the Senior Economist Western Europe declare that the views expressed herein are mine and are clear, fair and not misleading at the time of publication. They have not been influenced by any relationship, either a personal relationship of mine or a relationship of the firm, to any entity described or referred to herein nor to any client of Continuum Economics nor has any inducement been received in relation to those views. I further declare that in the preparation and publication of this report I have at all times followed all relevant Continuum Economics compliance protocols including those reasonably seeking to prevent the receipt or misuse of material non-public information.