The Aussie Chapter 5: Kiwi, a tale of two cities
In "The Aussie", we will look into the "well-known "correlation among the Aussie and well-known benchmark to give our readers a closer look towards factors that have been affecting the movement of the Australian Dollar. In Chapter 4, we will look into the performance of the Aussie relative to the Kiwi.
The Aussie and Kiwi, referred to the Antipodeans, are often viewed to be closely correlated given their proximity in geography and trade partnerships. They are also being categorized as commodity currencies, with their dependence in commodity export. In this chapter, we will look into the the performance of Aussie and Kiwi, with comparison to different economic perspective.
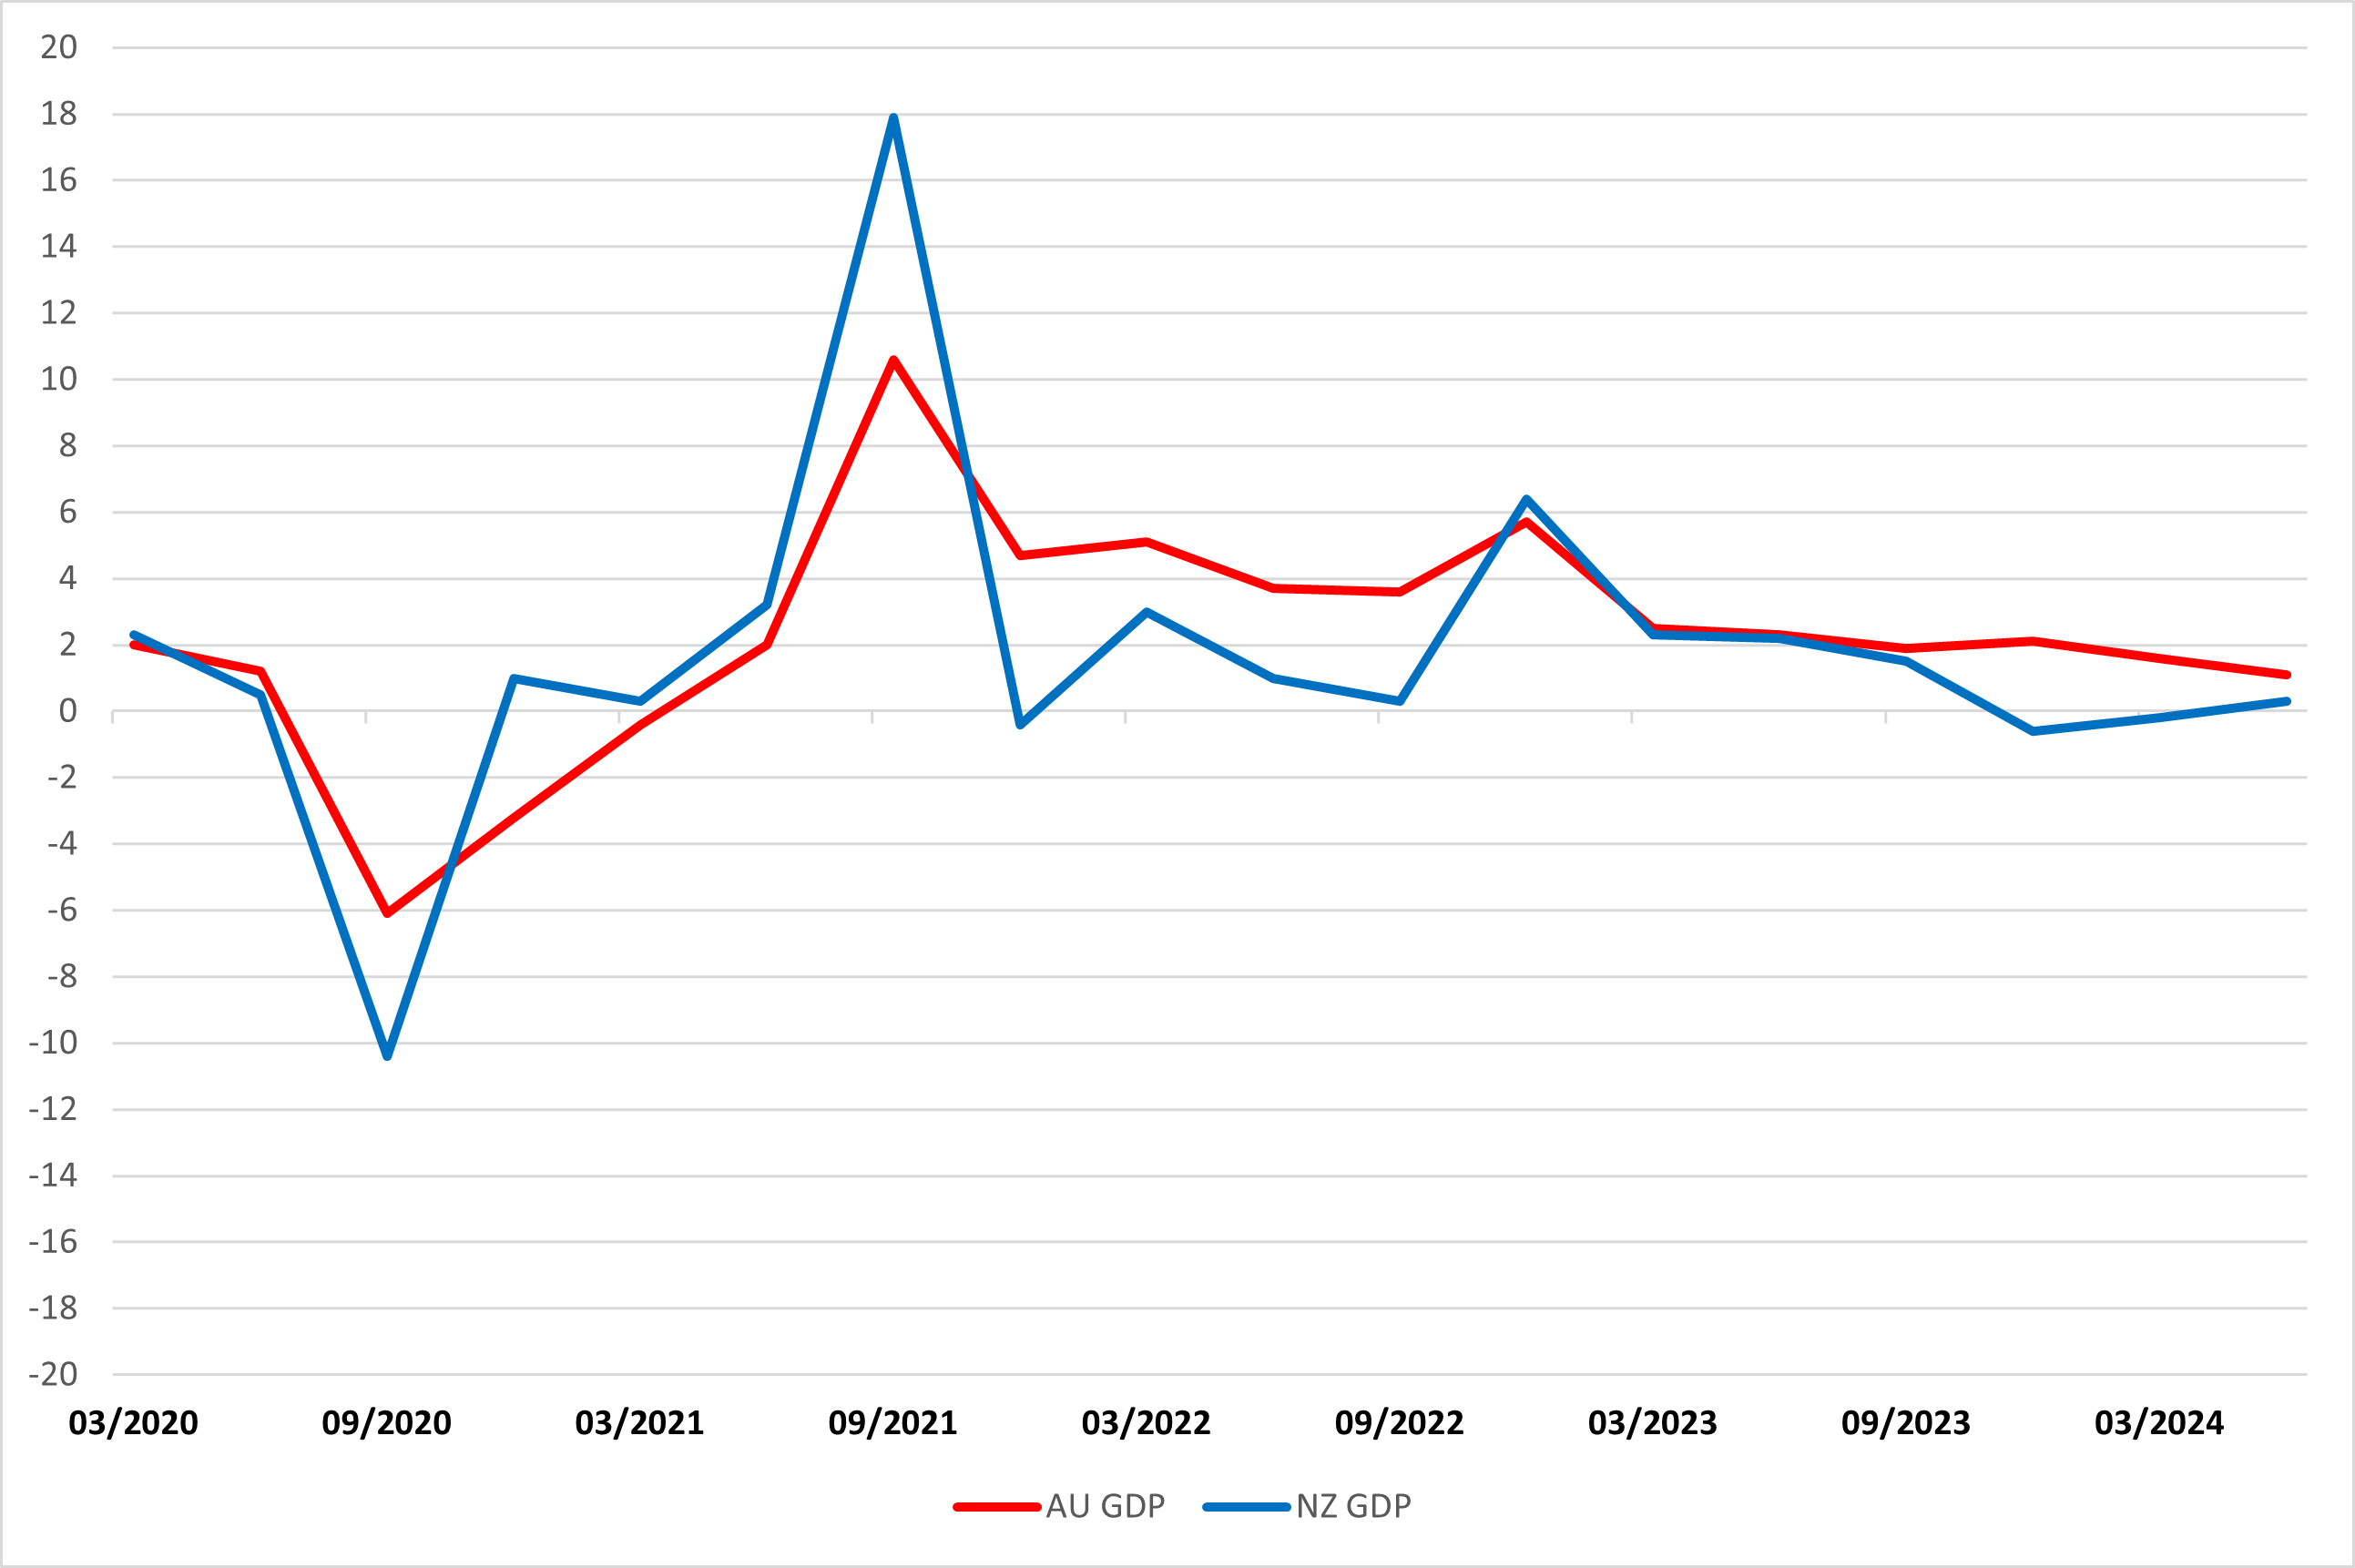
Figure 1: Australian and New Zealand GDP

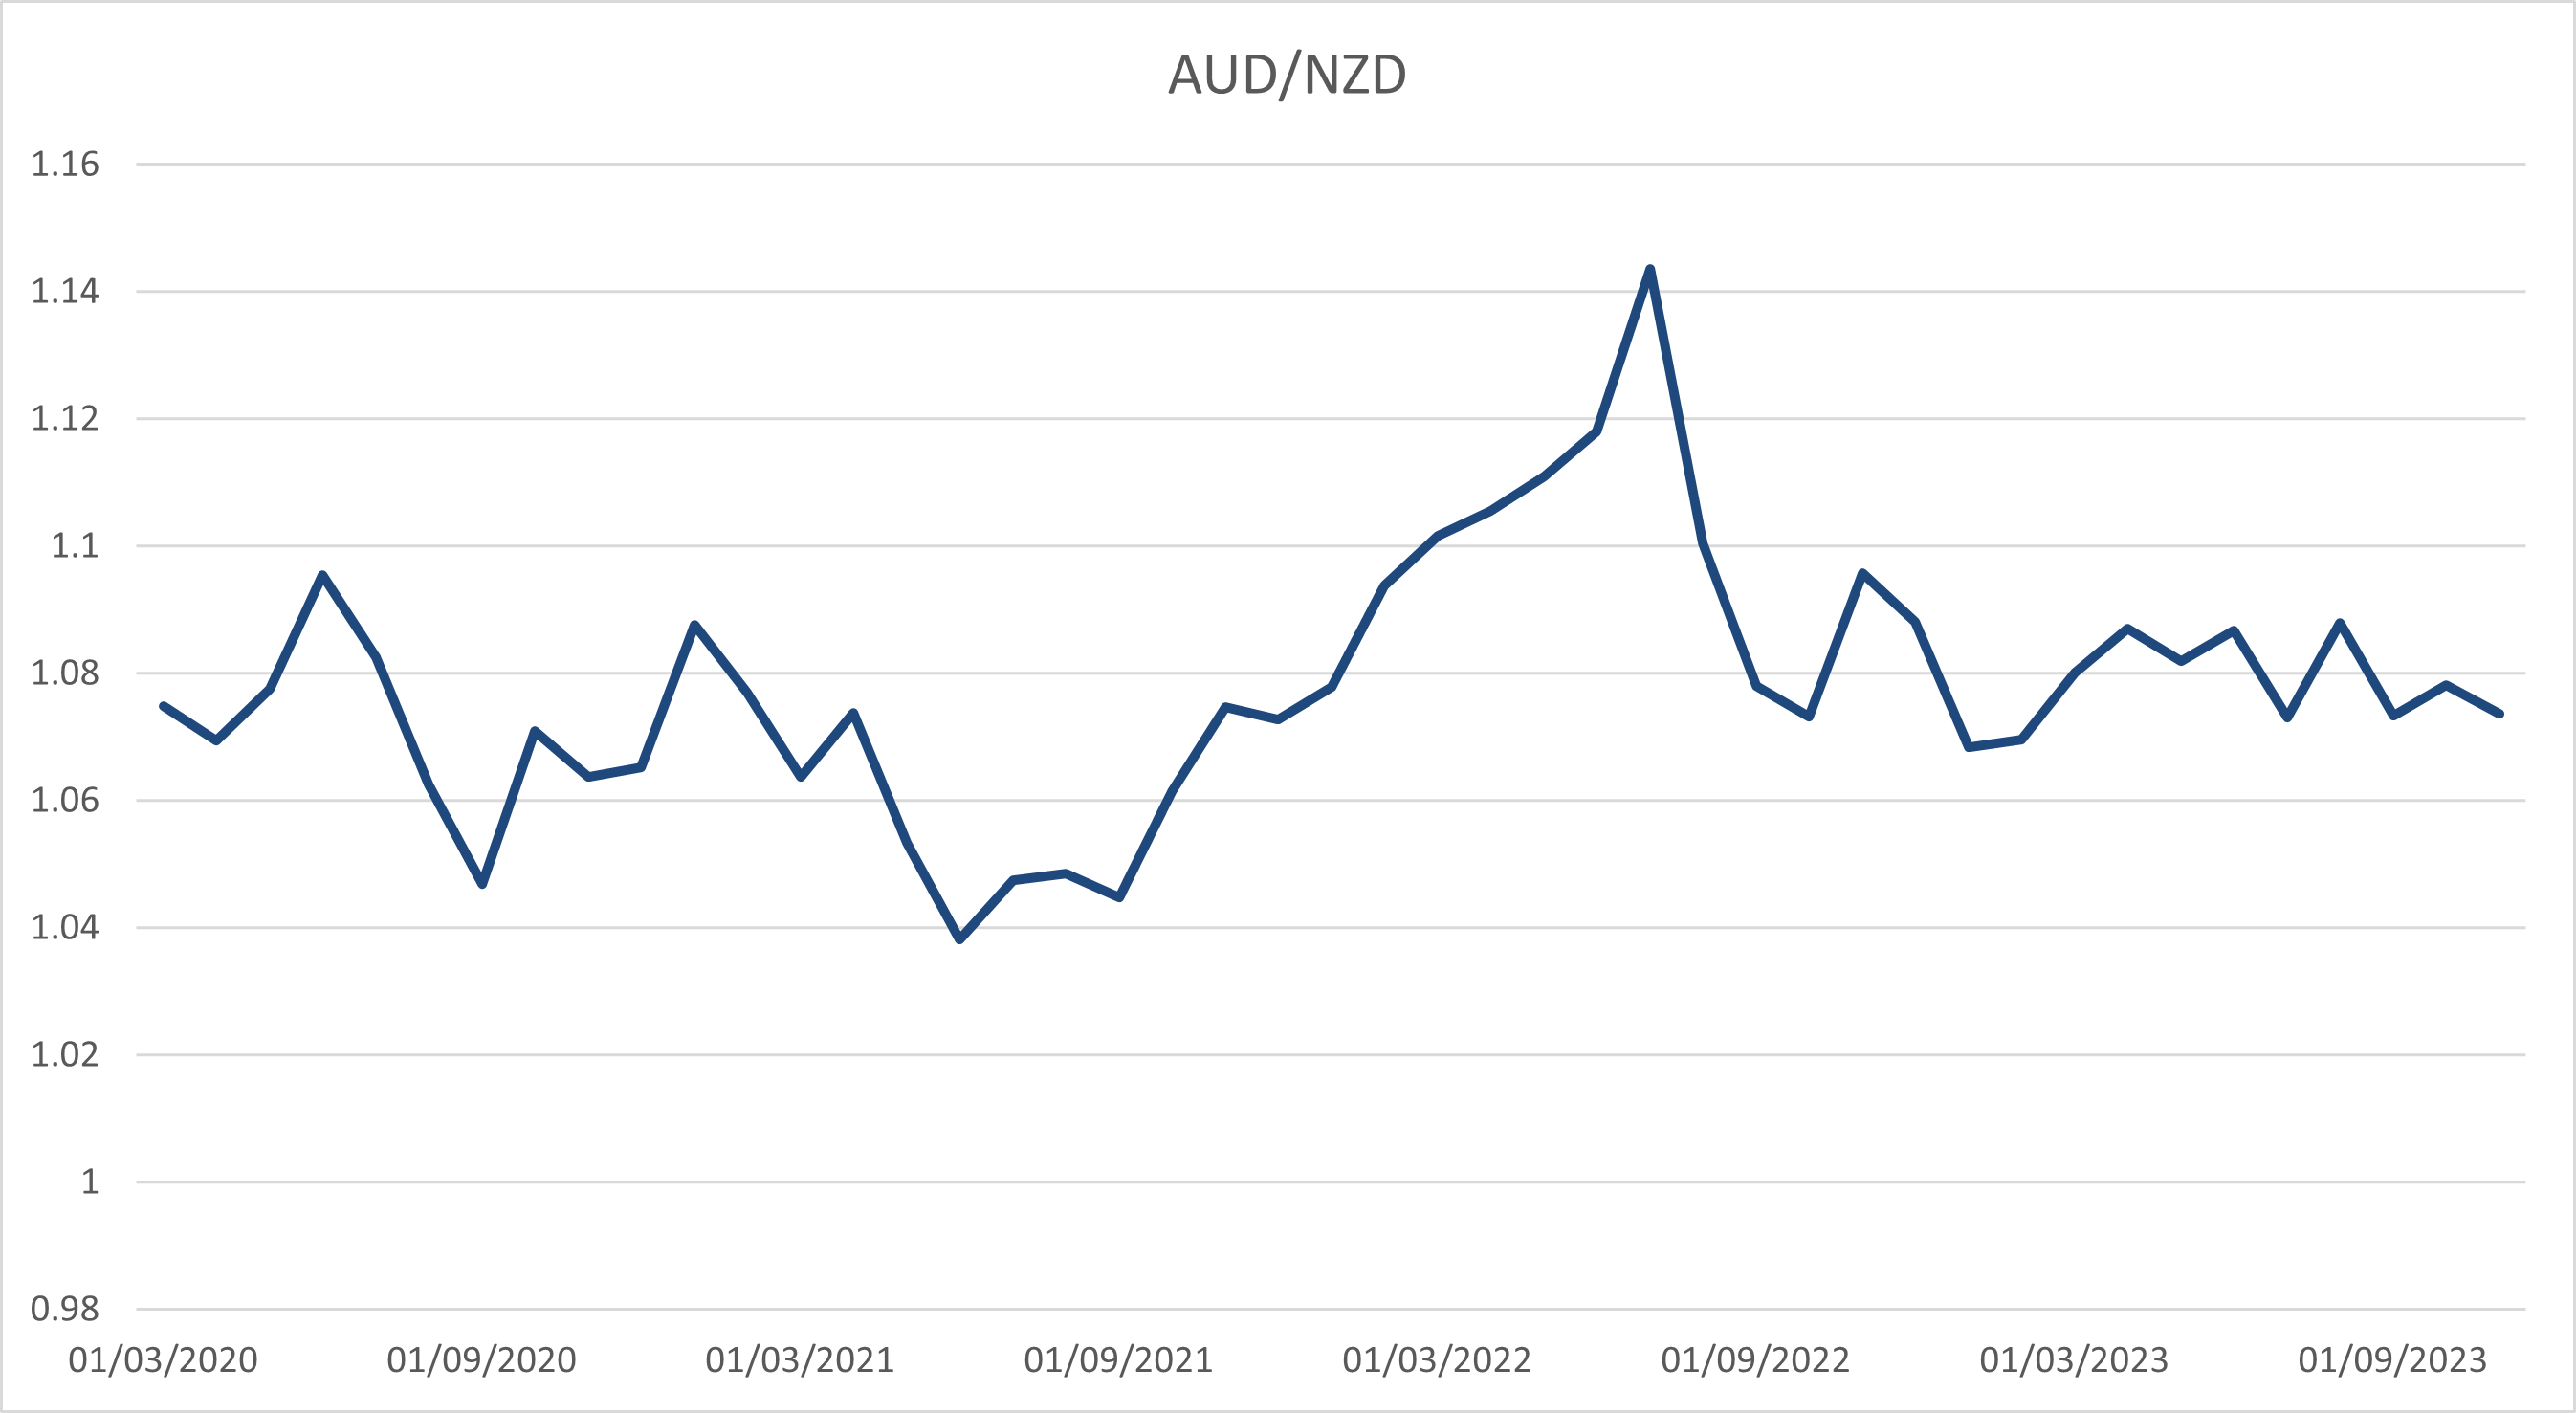
The Australian and New Zealand economy moves in a similar fashion but the NZ's GDP changes are more volatile (Figure 1). The volatility came in both upside and downside, which seems to suggest the volatility is driven by the relatively smaller GDP in NZ (70B NZD Q1 2024) than AU (610B AUD Q1 2024), instead of tilted towards either side from shocks. As the GDP is only released quarterly and economic data released between quarters can change market participants expectation, it looks like GDP would be a good indicator of overall trend (Figure 2)but its impact on FX rates can be front ran or lagged.
Figure 2: AUD/NZD Daily Chart

As major central banks has entered an era of dynamic interest rate in the past three years, inflation data may have seize market participant's attention because of its impact toward policy direction.
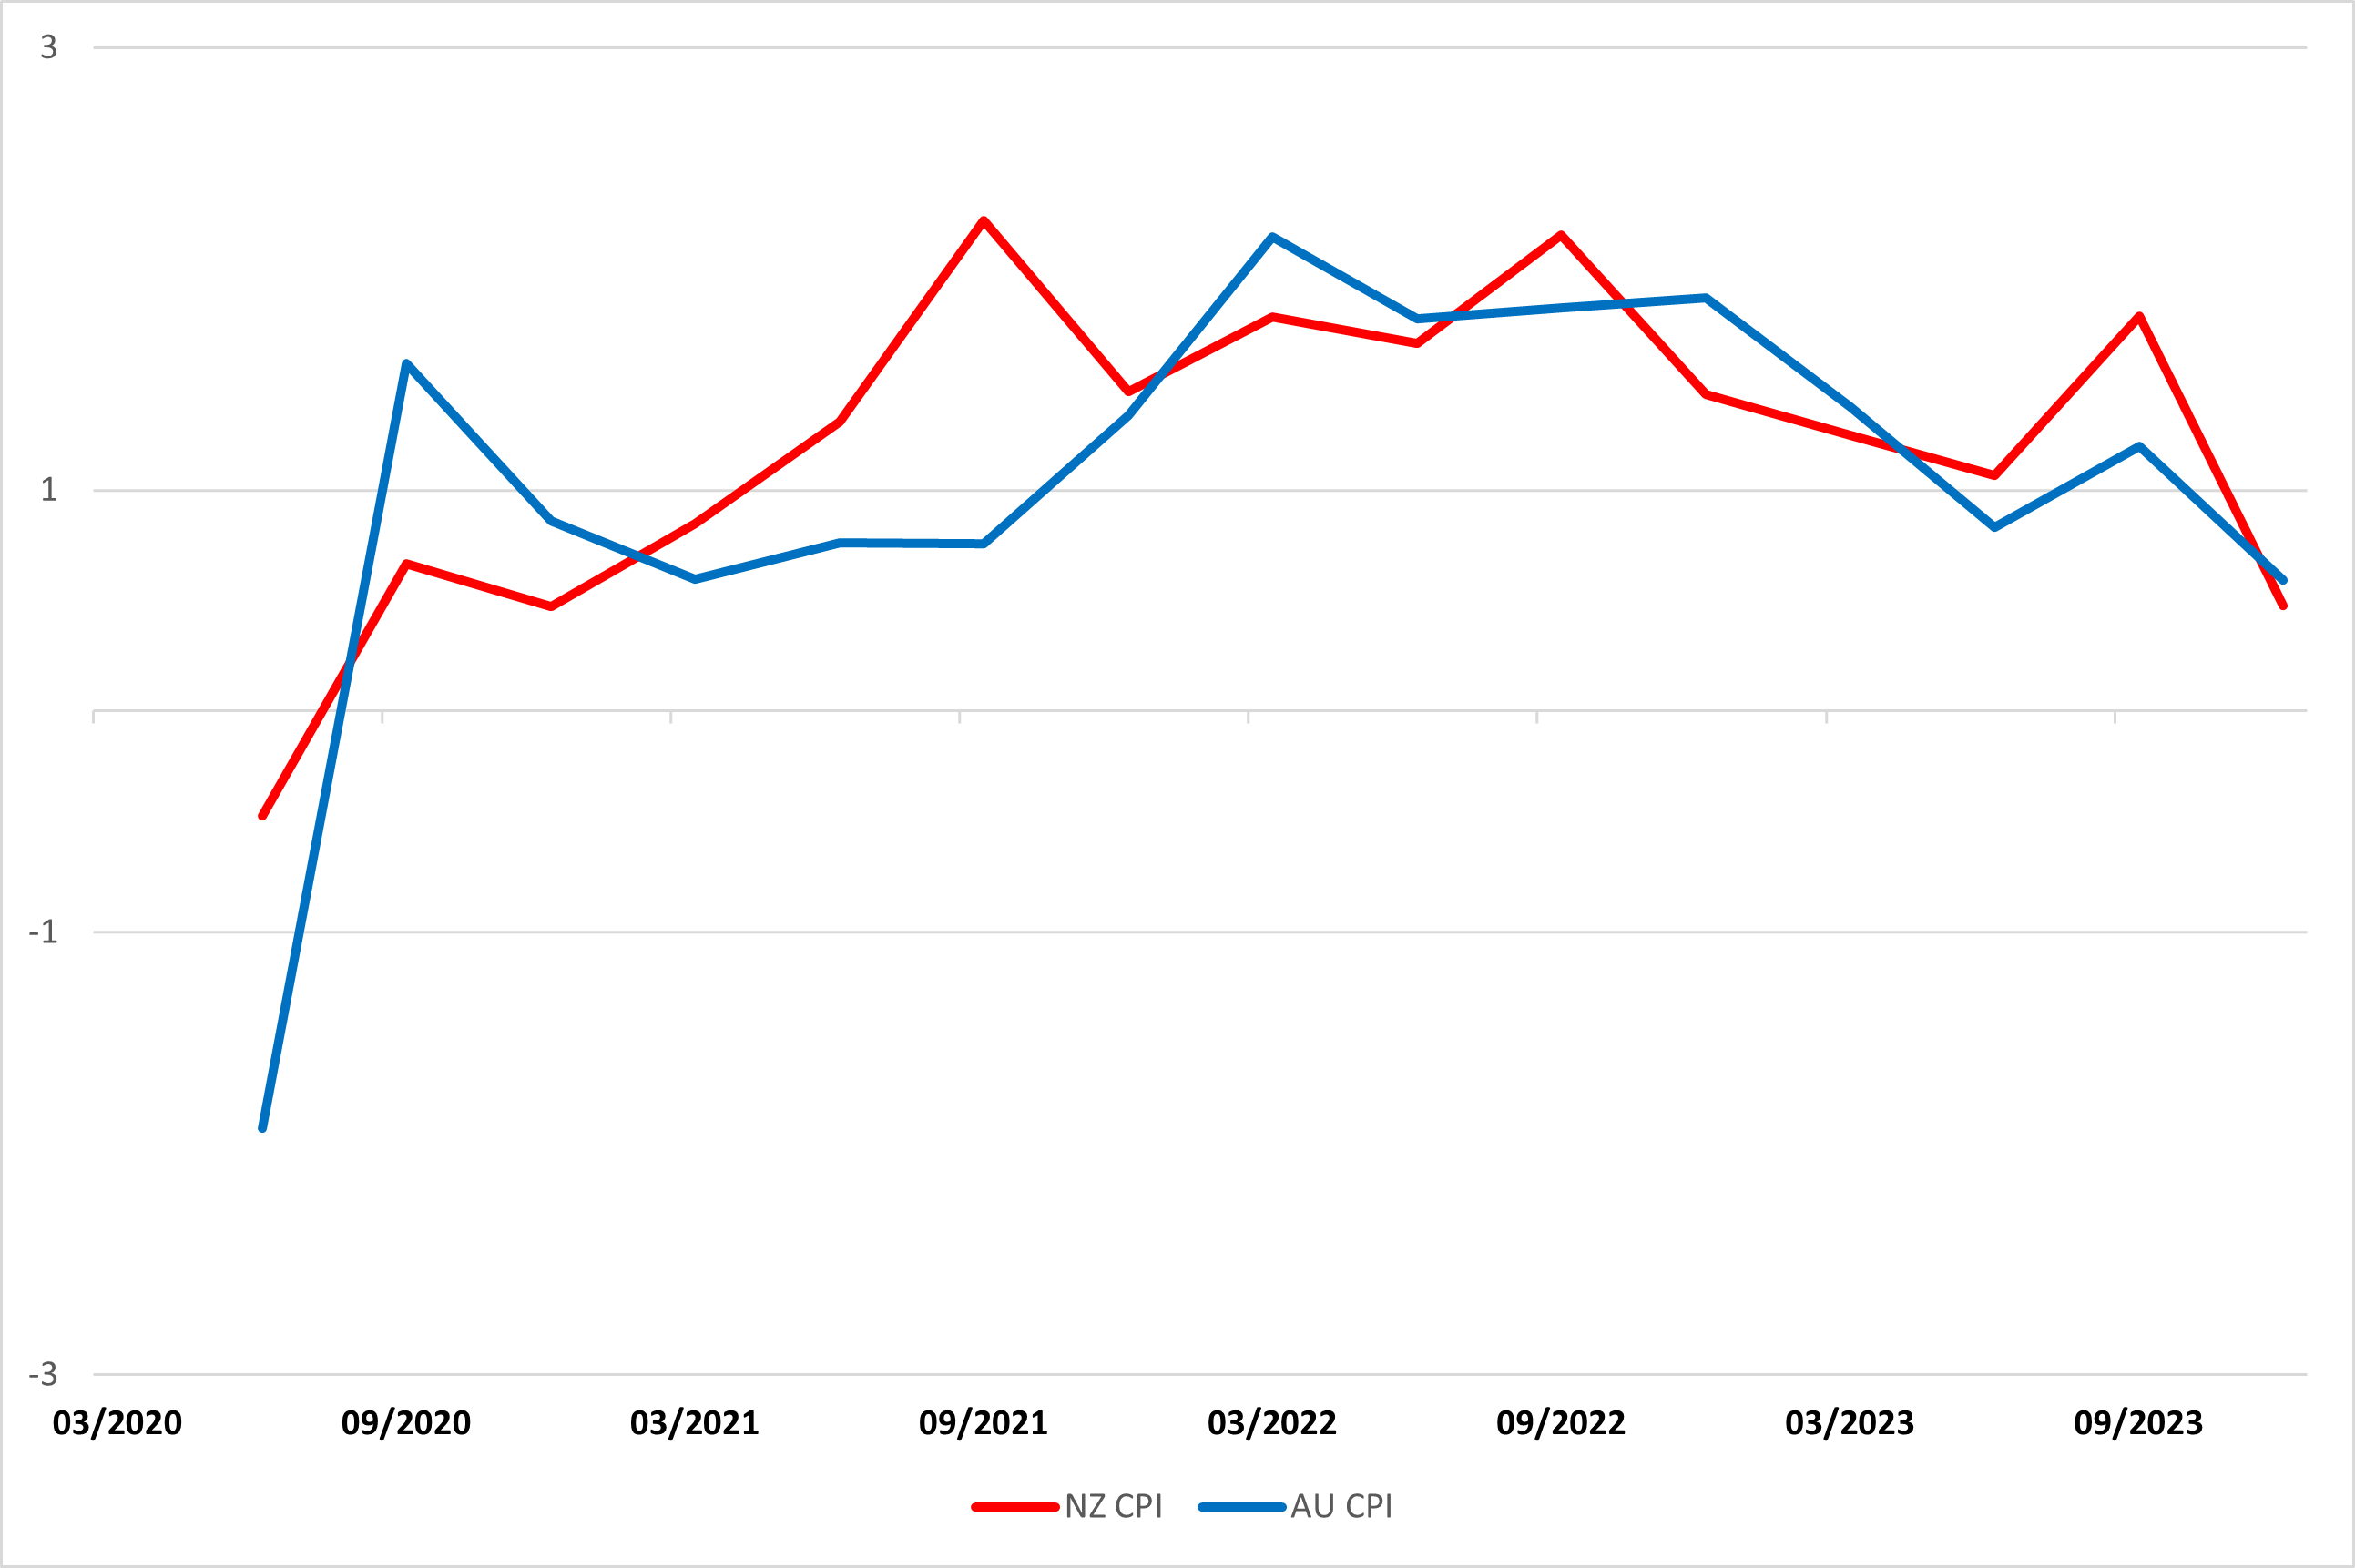
Figure 3: AU and NZ q/q CPI in Percentage Change

The inflation dynamics are different in Australia and New Zealand but overall trend is similar with heat after QE and begin to cool in the tightening cycle. But when you look closer between CPI (Figure 3) and AUD/NZD performance (Figure 2), it is visual that the movement in CPI tracks FX performance better than GDP changes as the speculation of yield changes in play. The weakness in AUD/NZD from Q2 2020/21 is also the period time when NZ inflation is higher than Australia. Right when Australian inflation picks up in Q3 2021, AUD/NZD rallied for almost a year before treading lower as both sides of inflation cools on higher rate. But is rate a even better driver?

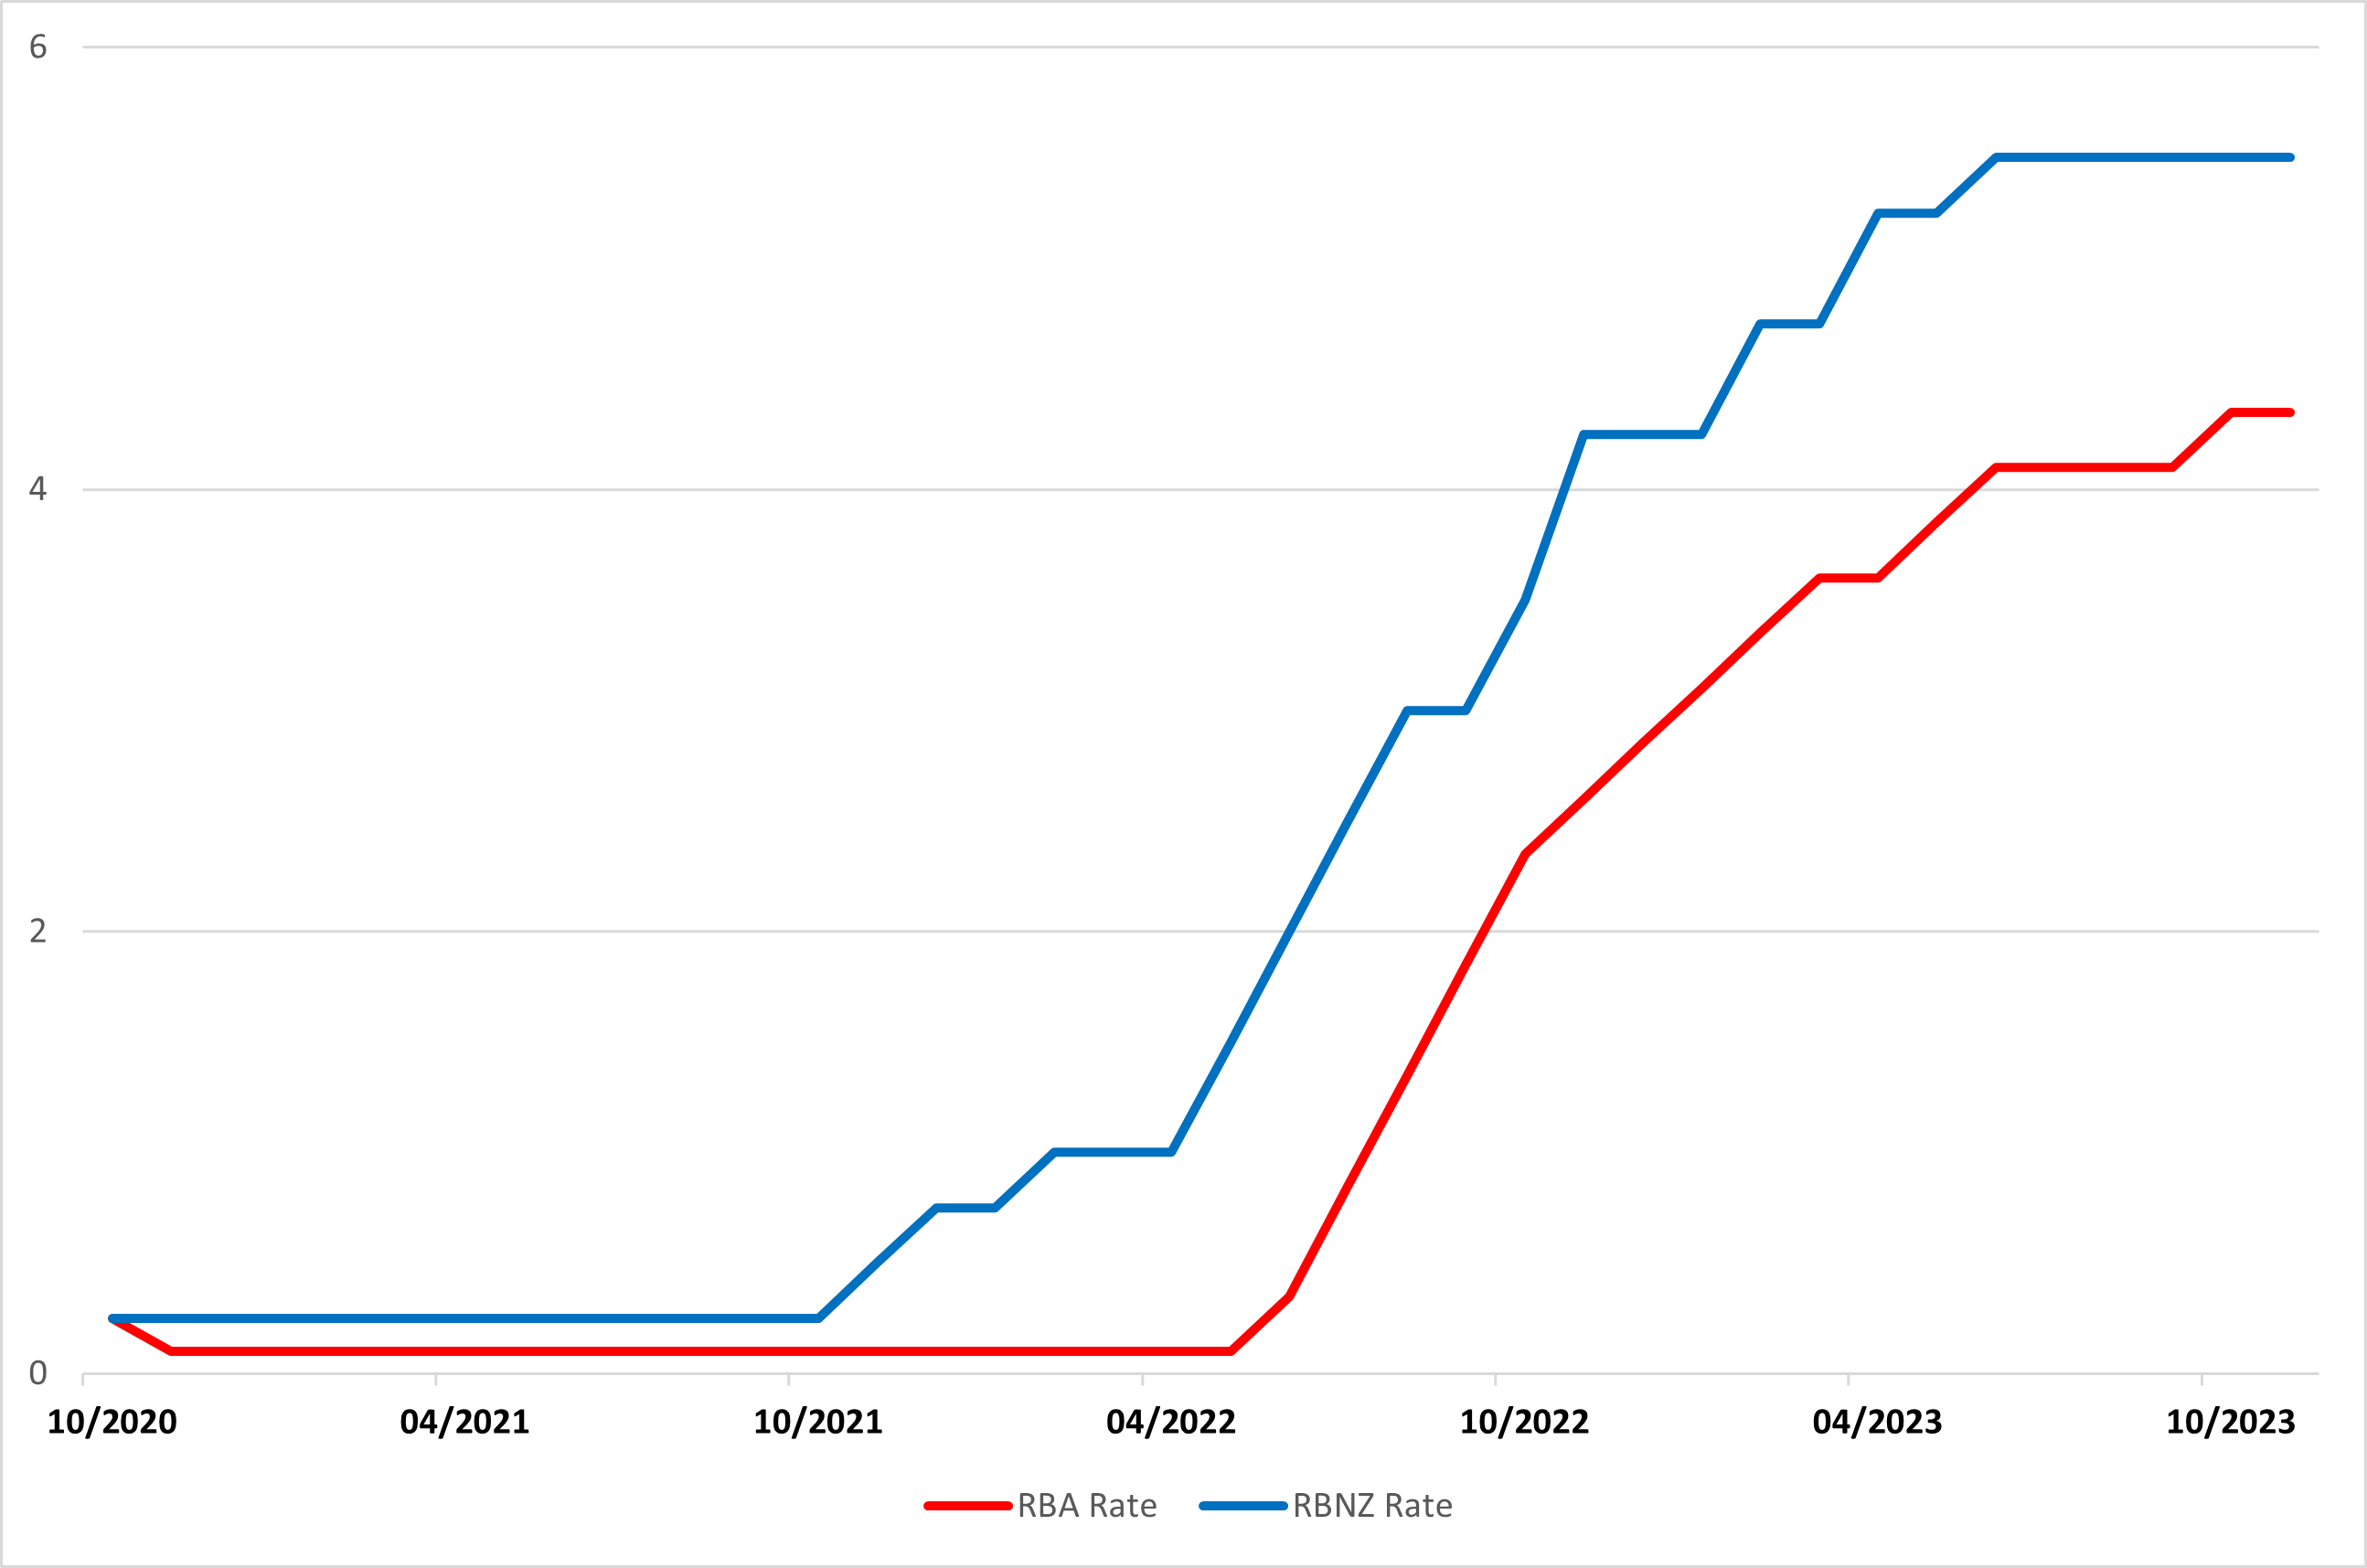
The RBNZ and RBA rates mostly track each other in tightening or easing cycle but are not parallel. Since early 2000, most of the time RBNZ's OCR is higher than RBA's Cash rate, apart from post GFC times. In the past three years, RBNZ's OCR is always higher than RBA's cash rate. If we only look at rates, it doesn't seem the currency performance has much correlation with rates parity. In Q4 2021to Q2 2022, the RBNZ has entered tightening cycle when RBA kept cash rate close to zero but we are not seeing the Kiwi to strengthen significantly against the Aussie. To the contrary, AUD/NZD strengthen sharply in the same period and only to begin to correct when RBA is middle in the tightening cycle. From such, rates are a worse indicator than CPI or GDP.