U.S. September Personal Income, Spending and Core PCE Prices, Q3 Employment Cost Index, Weekly Initial Claims - Mostly solid
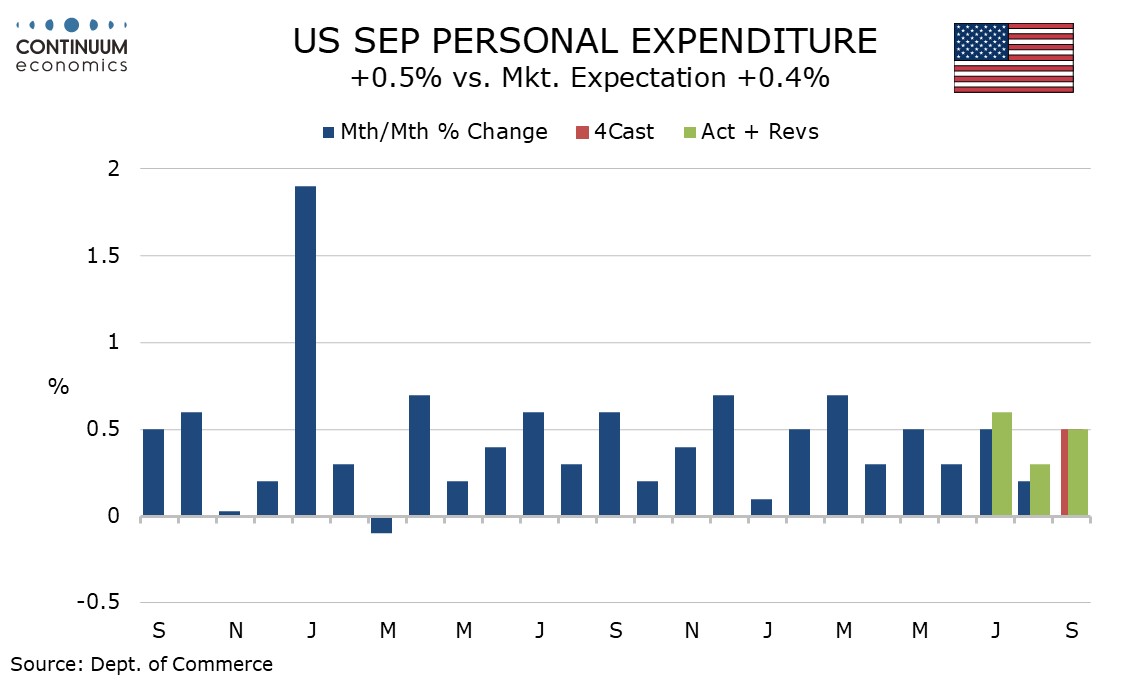
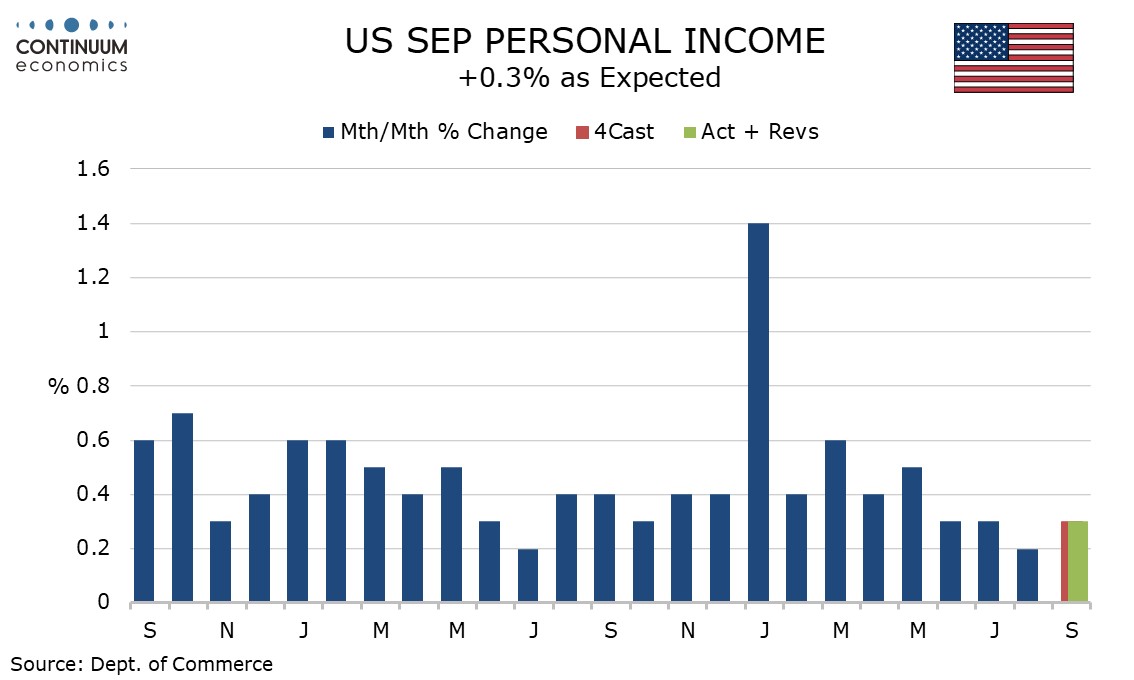
September’s personal income and spending data is largely old news with Q3 totals having been seen in the GDP report. As in Q3, growth in spending, of 0.5%, exceeds a 0.3% rise in income while core PCE prices are on the firm side of trend at 0.3%, though only 0.254% before rounding. The Employment Cost Index rise of 0.8% in Q3 is on the low side of expectations but initial claims at 216k from 228k show a strong labor market now hurricanes have passed.
Q3’s core PCE price index of 2.2% annualized was on the firm side of expectations but the September core PCE price index rise of 0.254% was softer than the core CPI which was on the firm side of 0.3% before rounding. August data was revised up to 0.2% from 0.1%, but only marginally before rounding, to 0.16% from 0.13%. July also saw a marginal upward revision before rounding, to 0.17% from 0.16%.
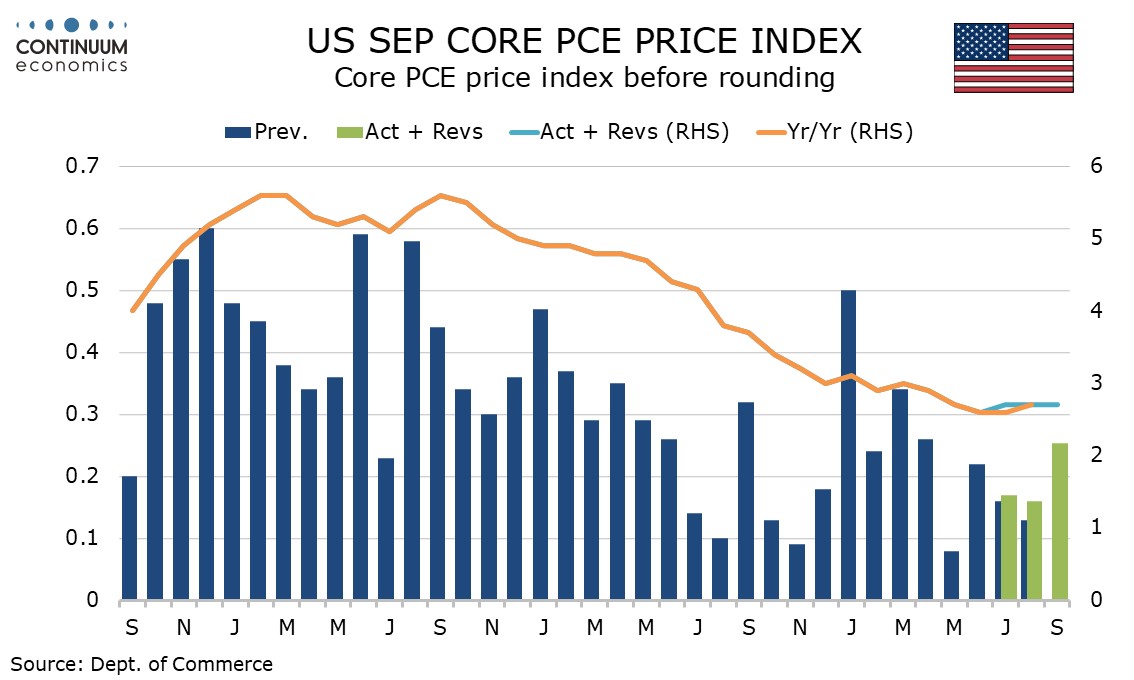
Core PCE prices are showing some residual seasonality even after seasonal adjustment and a similarly above trend number in September 2023 leaves yr/yr growth unchanged at 2.7%, still significantly above target, and with little change in the last five months. Overall PCE prices at 2.1% yr/yr from 2.3% in August are however at their lowest since February 2021 with the monthly gain restrained to 0.2% by softer gasoline.
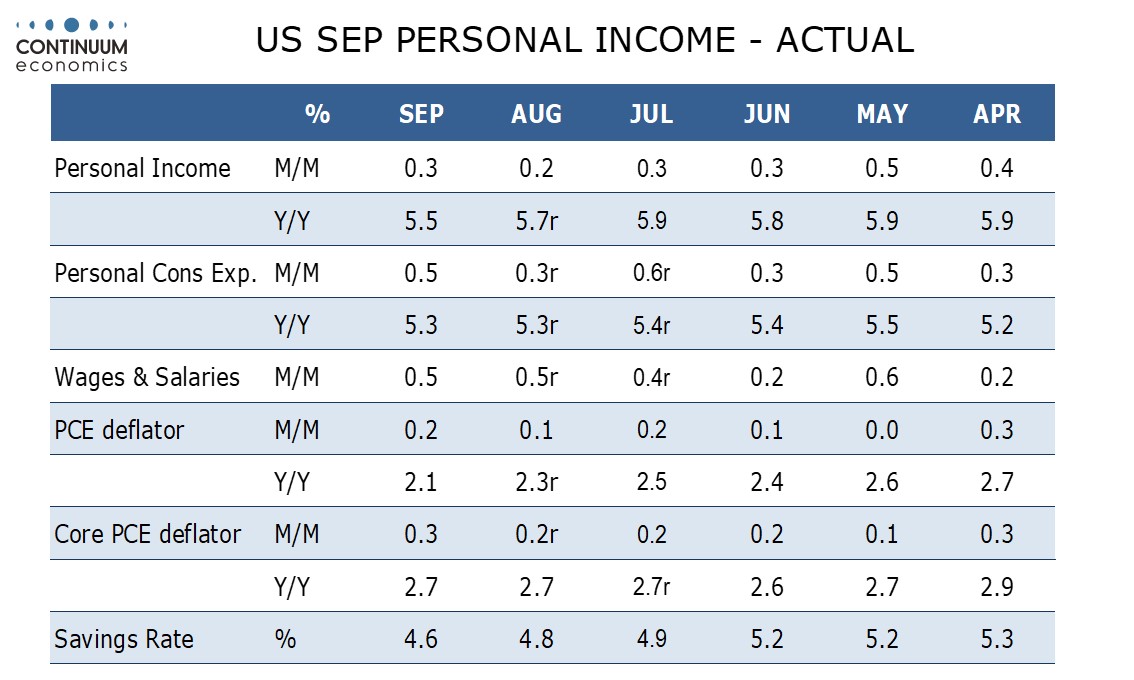
Q3 data saw spending significantly outperform income and a 0.5% September rise in personal spending was accompanied by upward back month revisions while a 0.3% rise in personal income saw no significant revisions. Wages and salaries are however outperforming personal income with a rise of 0.5% and here revisions to July and August were upwards. Declining personal interest income has been the main restraint on overall personal income through Q3.
While Q3 saw spending significantly outperforming income and the savings rate has fallen to 4.6% in September from 5.2% in June, on a yr/yr versus real disposable income and real personal spending are consistent, both up by 3.1%, suggesting solid underlying momentum.
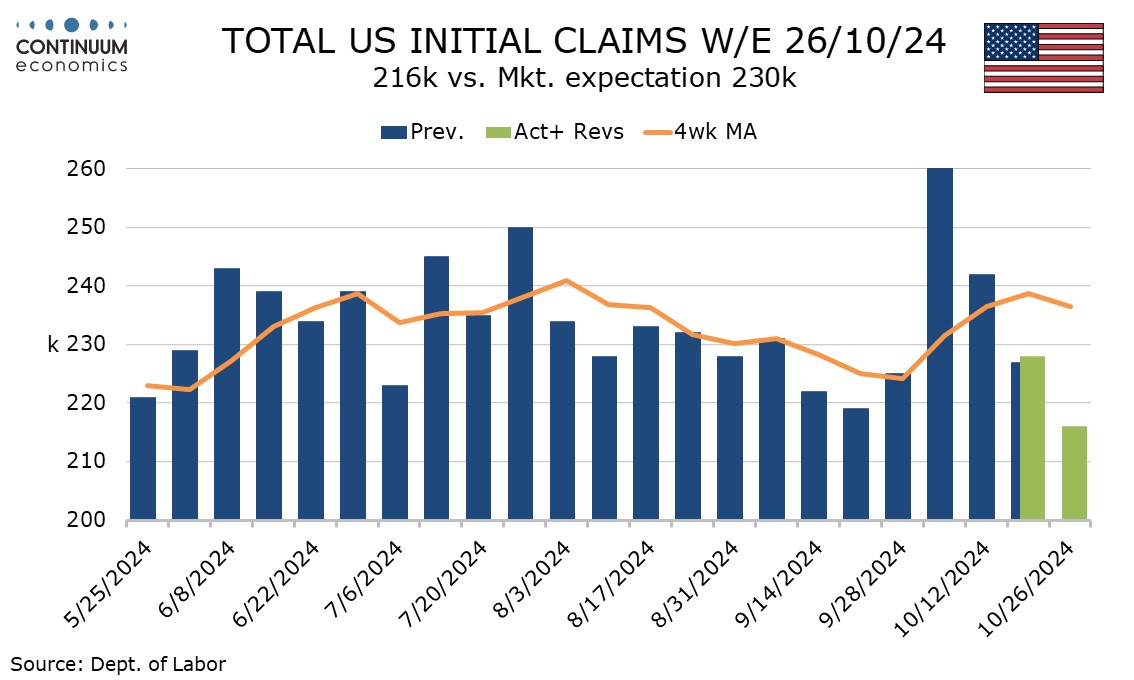
Initial claims at 216k are at their lowest since May 18 and have thus fully reversed the bounce to 260k that followed Hurricane Helene, while Hurricane Milton helped keep claims elevated at 242k the week after, coming in the October non-farm payroll survey week. We continue to expect a weak 75k increase in October’s payroll but subsequent initial claims data suggests that any weakness in October payrolls will be temporary. 33k strikers at Boeing will be a further restraint on payrolls.
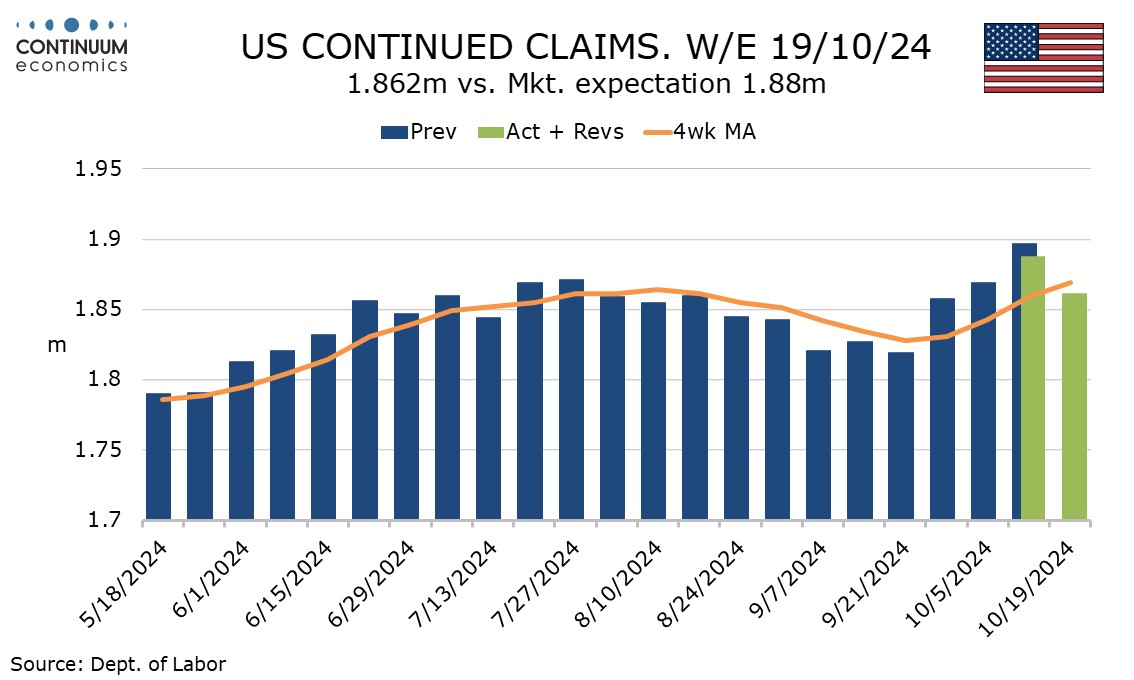
Continued claims saw their first decline in four weeks, by 26k to 1.862m, but have not yet fully reversed their recent bounce. That is in part because continued claims cover the week before initial claims, but it also suggests that some of those who lost jobs in the Hurricanes have not found work yet.
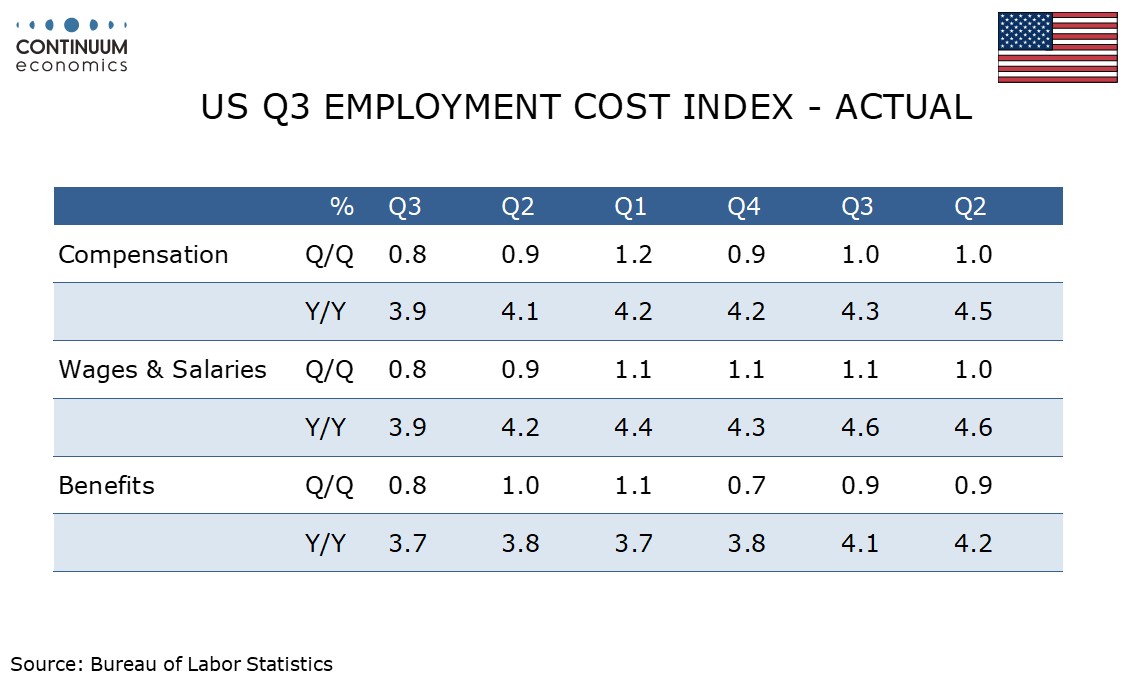
While initial claims suggest the labor market remains strong, the Q3 Employment Cost Index suggests some loss of labor market pressure, with the 0.8% increase, from 0.9% in Q2, the slowest since Q2 2021. It is still however marginally above the pre-pandemic trend of 0.7%.
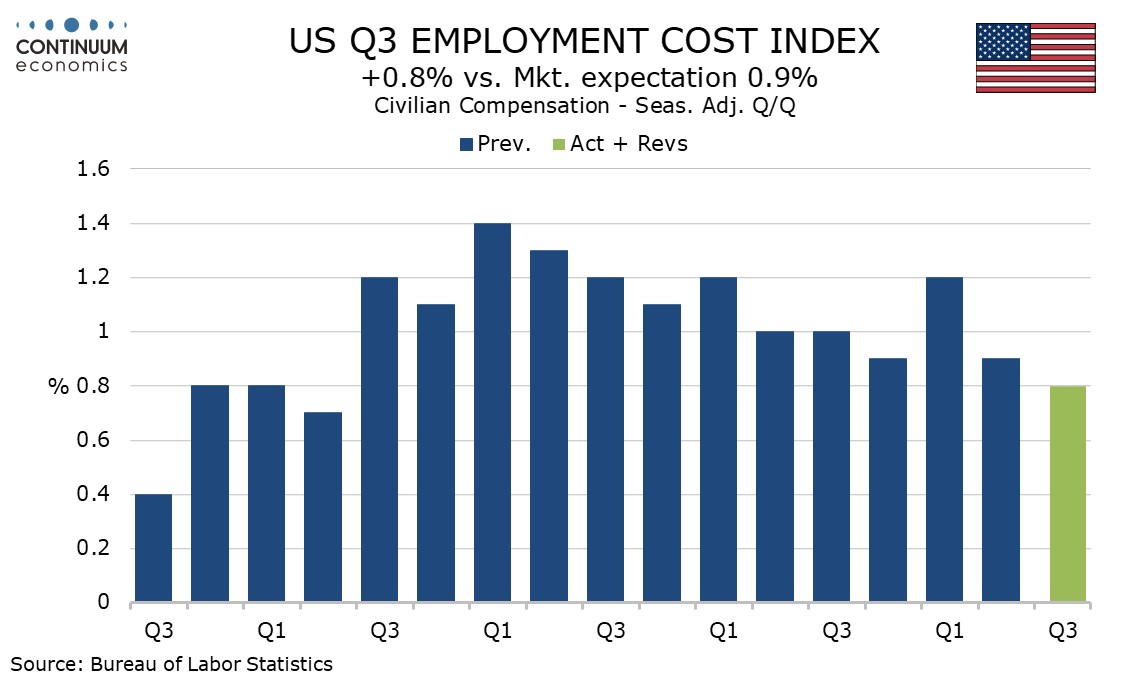
Wages and salaries and benefit costs both increased by 0.8% in Q3. Yr/yr growth slipped to 3.9% from 4.1% overall, with wages and salaries at 3.9% and benefit costs at 3.7%. Before the pandemic yr/yr growth was trending a little below 3.0%, so wage pressures, while down, are not yet out.
