BoE Preview (Apr 30) Divided Again But Unmoved (For Now)?
Very clearly, the BoE kept rates on hold with the MPC unanimous last month and the same decision is expected this time around but with probable fresh dissent, with up to 2-3 members opting for an immediate hike. These splits will be even more evident in the individual MPC member statements (as expected) where more diverging views may again act to confuse markets seeking a clearer communication from the BoE. But the MPC overall will retain a more neutral stance, being ‘ready to act as necessary to ensure that CPI inflation remains on track to meet the 2% target in the medium term’. The minutes may again suggest that this is symmetric that policy may have to be more or less restrictive depending on the economic impact, albeit with the alternative scenario based more towards inflation persistence. However, Governor Bailey may repeat is assertion that downside and upside risks exist together. What is notable and as the updated projections may show, is that this energy shock is justifiably viewed as being different to that of 2022, occurring at a point when the economy is operating with a margin of spare capacity. We think this very much reduces the chances of second round effects.
Figure 1: Bank Rate and Financial Conditions Diverging (% and level)
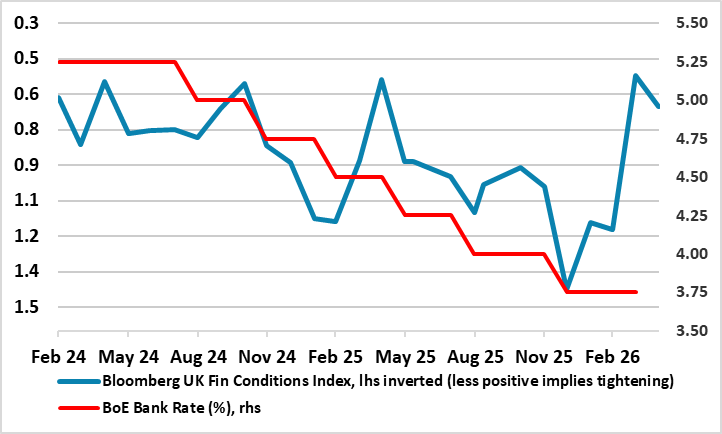
Source: Bloomberg, BOE, Continuum Economics
Given ever tighter financial conditions (Figure 1), which received several mentions in the BoE updates, we still see at least two and probably three more 25 bp rate cuts ahead but now deferred to starting no sooner than Q4 and then extending into 2027. This is based on our baseline view of a 4-8 week Iran war and energy prices coming down from Q2 but also possibly encompasses the further tightening in financial conditions hinted at by BoE Dep Governor Breeden who said ‘There’s a lot of risk out there and yet asset prices are at all-time highs. We expect there will be an adjustment at some point’. Regardless, the more hawkish members are already more open about considering hikes to guard against or combat any rise in inflation expectations that they think may trigger a fresh rise in wage pressures. But we suggest that the labor market is not only different to four years ago and the Ukraine War but even to the pre-pandemic era (Figure 2). But even the hawks are only seeing a couple of hikes, with Governor Bailey having done his best to rein in over-zealous market thinking which at one stage a few weeks ago was penciling in four such 25 bp increases.
As far as assessing slack, rather than unemployment highlighting supply, labour demand is also important, this best highlighted by job vacancies. A crucial relationship between the jobless and vacancy rate can be plotted as a scatter diagram with each point representing the combination of the two series at different points in time. This is known as a “Beveridge curve”.
Structural Shift Underway?
Rather than just points, trend lines can be estimated to arrive at a more fully fledged Beveridge curve which offers a clearer picture whether a more structural than cyclical shift in the labor market has taken place. In this regard, it is the case that changes in the business cycle cause movements along the curve, with booms moving it up/left and recessions moving it down/right. But the whole curve can shift too so that an outward shift (up and to the right) indicates a less efficient labor market, where more vacancies exist for any given level of unemployment (eg skill mismatches), while an inward shift suggest the very opposite.
Figure 2: A Structural Shift in the Labor Market
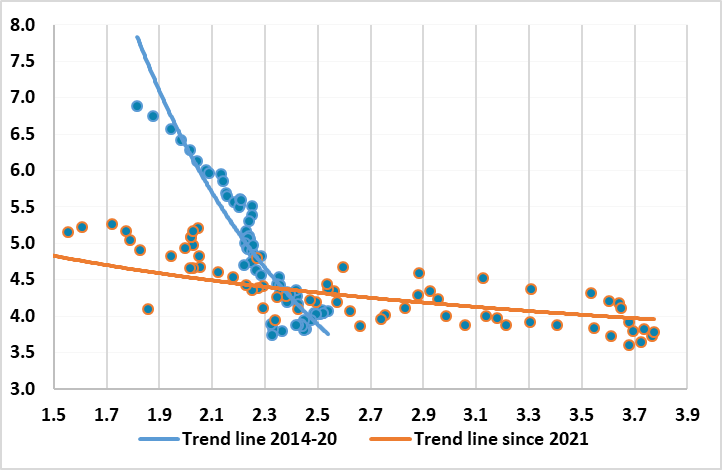
Source: ONS, CE (y-axis: unemployment rate; x-axis: job vacancies as % of labor force)
And the latter seems to have occurred in the last few years. As Figure 2 shows, the Beveridge curve of the last six years has shifted down compared to the curve of the decade before, albeit the former partly crossing the latter. This is important as it is less conclusive in suggesting that the UK labor market may be less wage inflation prone not only compared to four years ago and the outbreak of the Ukraine War but even compared to the low inflation decade before the pandemic. Even so, results suggesting more supply for any given level of demand hardly support the more wage persistent view offered by MPC hawks. But this is the main reason we see the current energy spike having few lasting consequences in terms of second round or spill over effects. Indeed, softer labor cost pressures are already visible as private sector regular earnings are now running at below 3%, the lowest since pandemic related pressures softened them in mid-2020. They are also therefore running at a pace consistent with the 2% CPI target, this on the assumption of productivity growth of around 1%.
It is notable that Governor Bailey has referenced the approach of the BoE in 2011, which kept rates on hold even as UK energy inflation soared to 20%, citing its mandate to tolerate deviations from target in a bid to avoid unnecessary harm to the economy and jobs. A BoE survey of senior executives released this week offered tentative support for Bailey’s wait-and-see approach, with evidence that companies will resist inflation-fuelling pressure from workers for higher wages in response to the current crisis. The expected wage growth reading in the regular BoE-compiled Decision Makers Survey is among the weakest since 2022 and would also point to pay growth on track to be broadly consistent with the BoE’s inflation target. The survey also showed expectations for employment growth falling into deeper negative territory, while consumer price expectations were higher for the coming year but stable at three-year horizon. All of which adds to a picture of a UK economic backdrop vastly and increasingly different to four years ago.