U.S. December Personal Income, Spending and Core PCE Prices confirm Q4 totals, Q4 Employment Cost Index as expected
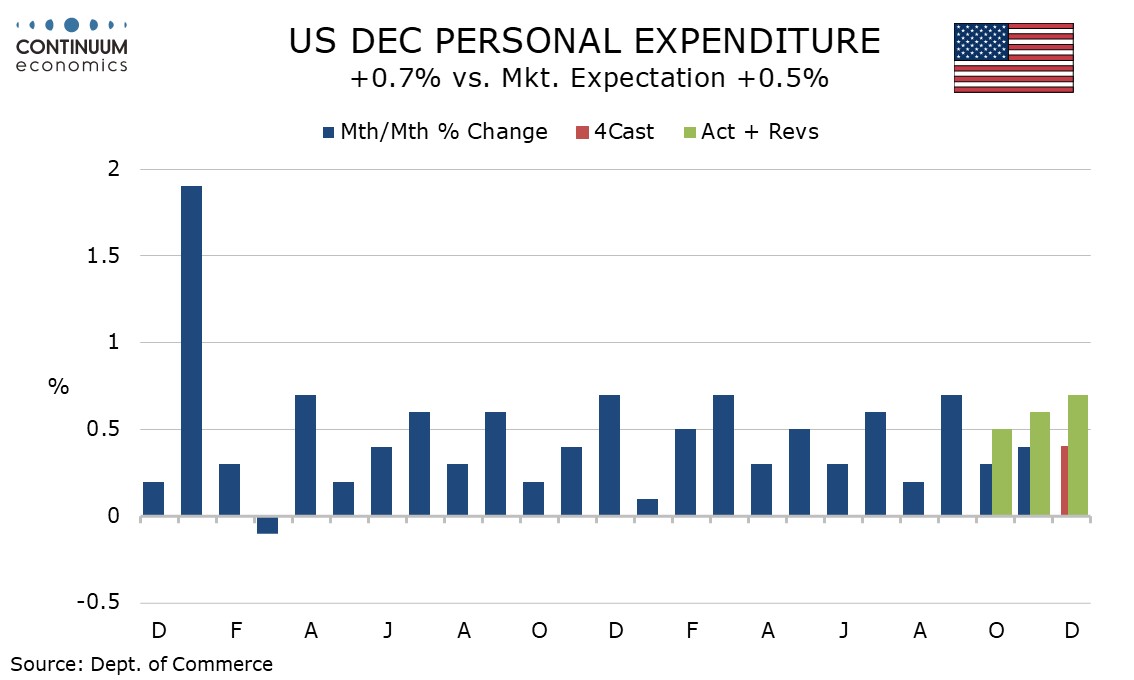
December’s personal income and spending data is largely old news with Q4 totals having been seen in the GDP report. Gains of 0.2% in core PCE prices and 0.4% in personal income are in line with expectations, but spending with a 0.7% increase with positive back month revisions reflects the strong consumer spending performance in the Q4 GDP detail. A 0.9% rise in the Q4 employment cost index is in line with expectations.
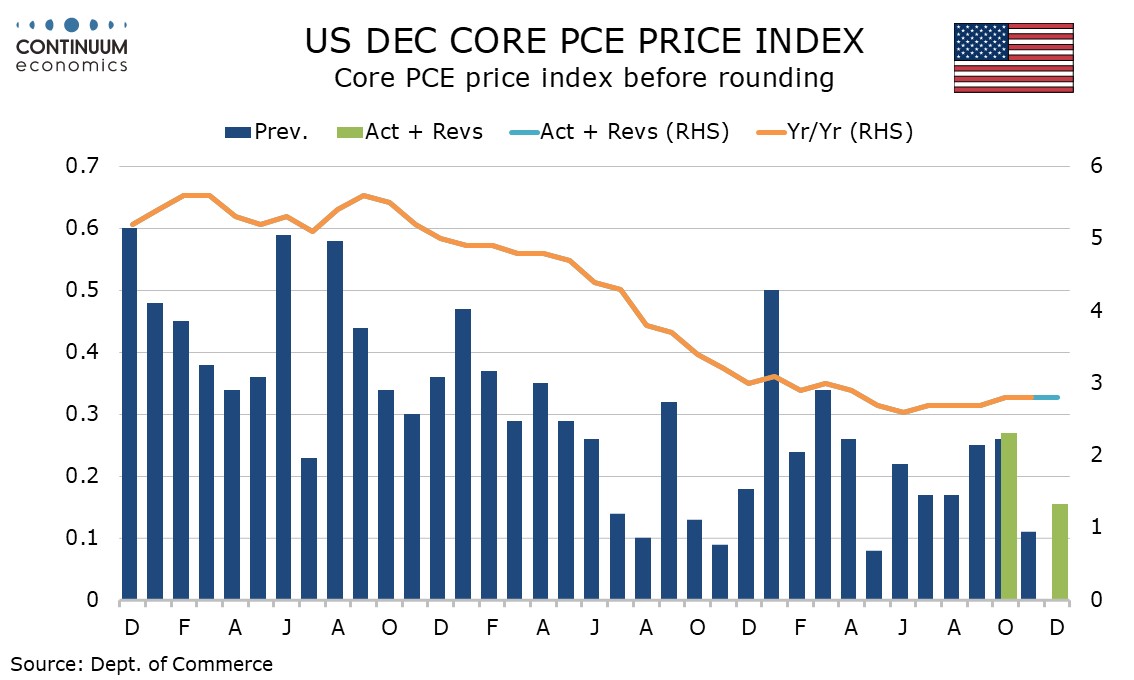
Before rounding, the core PCE price index is up only 0.156%, so will be seen as an encouraging figure by the Fed. Overall core PCE prices were also rounded up, to 0.3% from 0.256% before rounding. Yr/yr core PCE prices were stable at 2.8% but the overall PCE price index rose to 2.6% yr/yr from 2.4%, still below the core. These numbers were all in line with expectations.
The personal income detail showed wages and salaries up by 0.4% with the other components of personal income unusually keeping pace with wages and salaries. Personal interest income has picked up in Q4. Personal spending gains were broad based with non-durables leading in nominal terms and durables leading in real terms.
Real disposable income rose by only 0.1% for a second straight month and income underperforming spending saw the savings rate fall to 3.8%, its lowest since December 2023. If prices are lifted by tariffs, that could restrain real disposable income further.
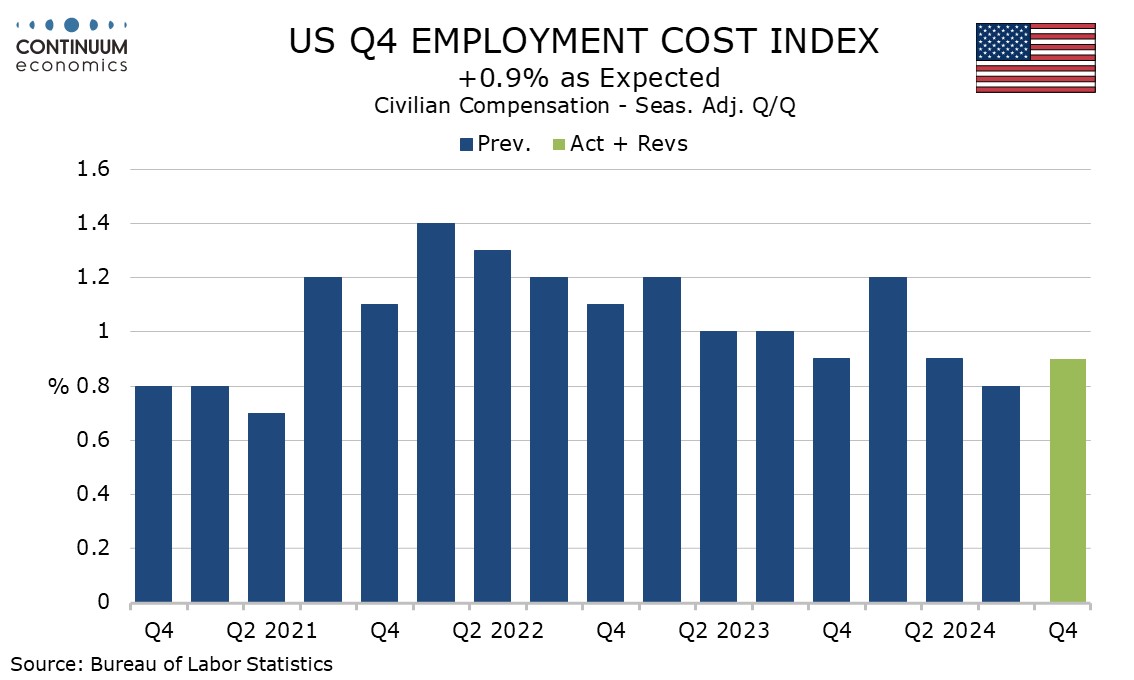
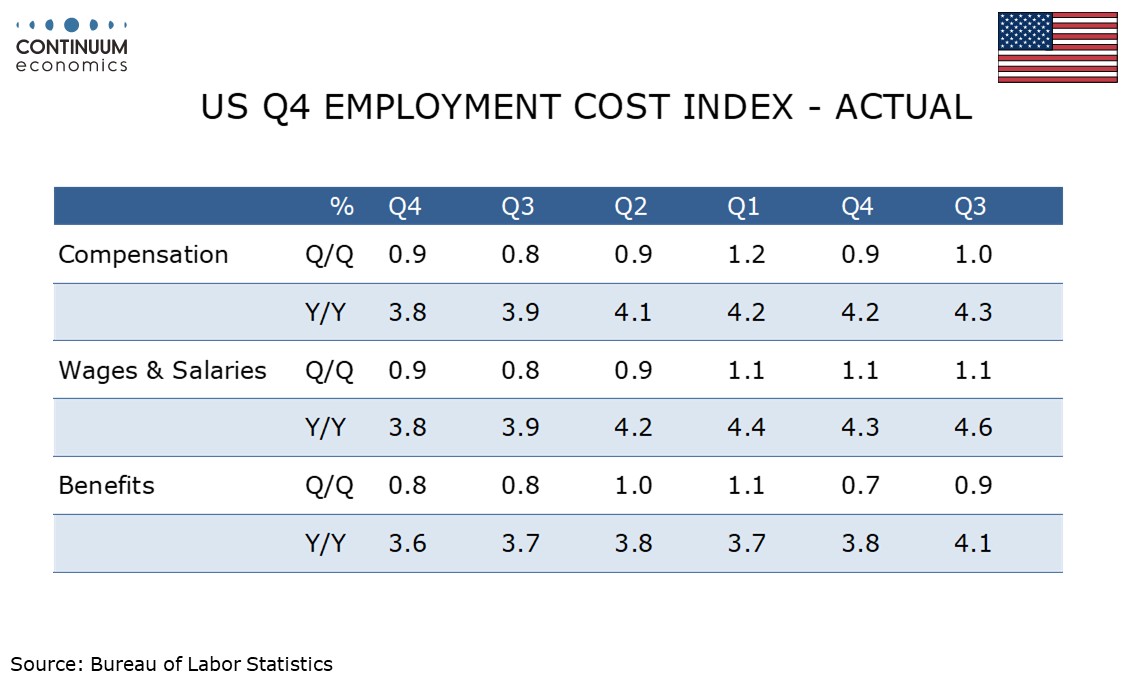
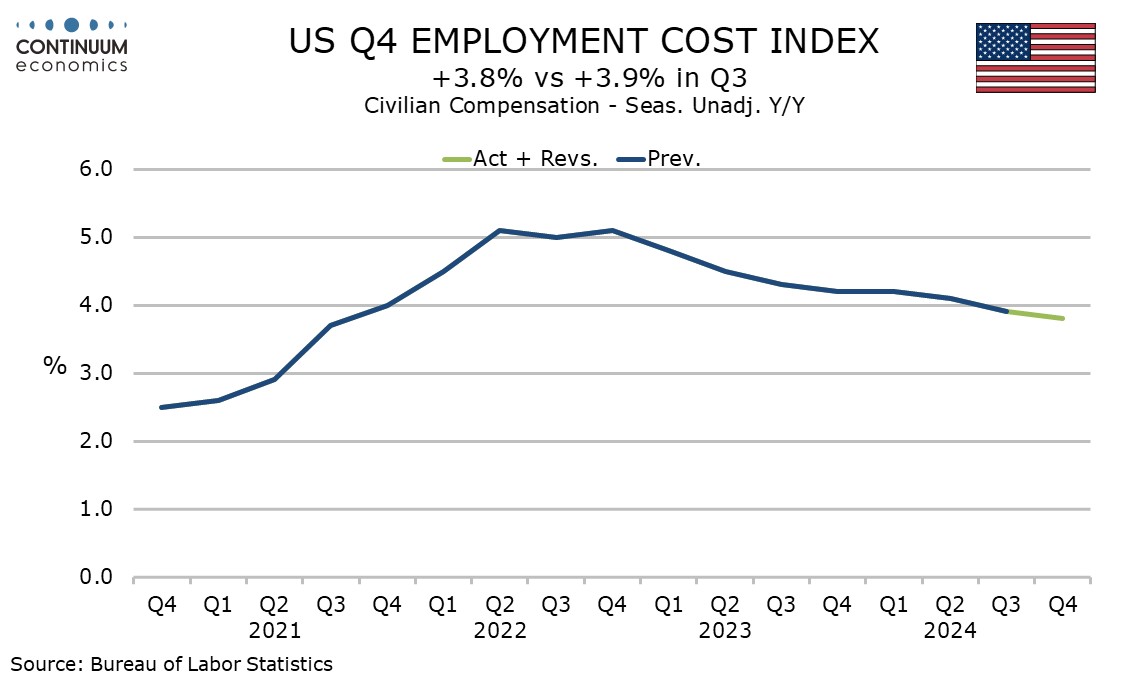
The 0.9% increase in Q4’s Employment Cost index is slightly stronger than Q2’s 0.8% but still saw yr/yr growth fall to 3.8% from 3.9%. This is the lowest yr/yr pace since Q3 2021 but remains above the pre-pandemic trend that was running a little below 3.0%.
Monthly detail showed wages and salaries up by 0.9% and benefits up by 0.8%, with the respective yr/yr paces being 3.8% and 3.6%.