U.S. Q2 GDP Momentum and Implications for Q3

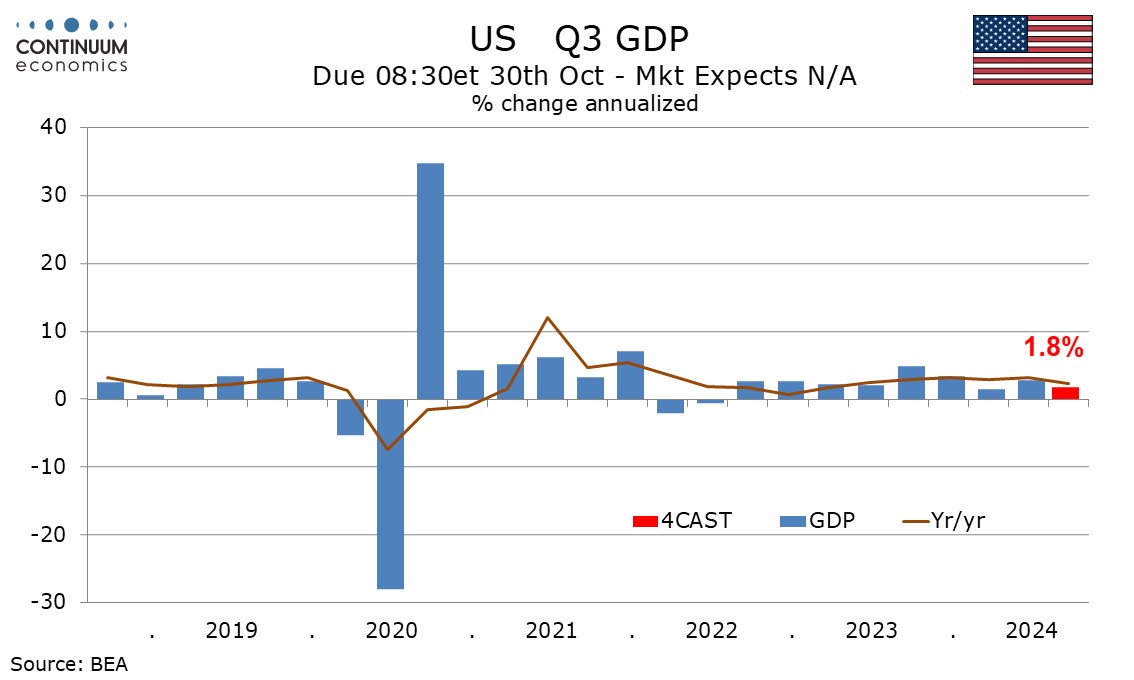
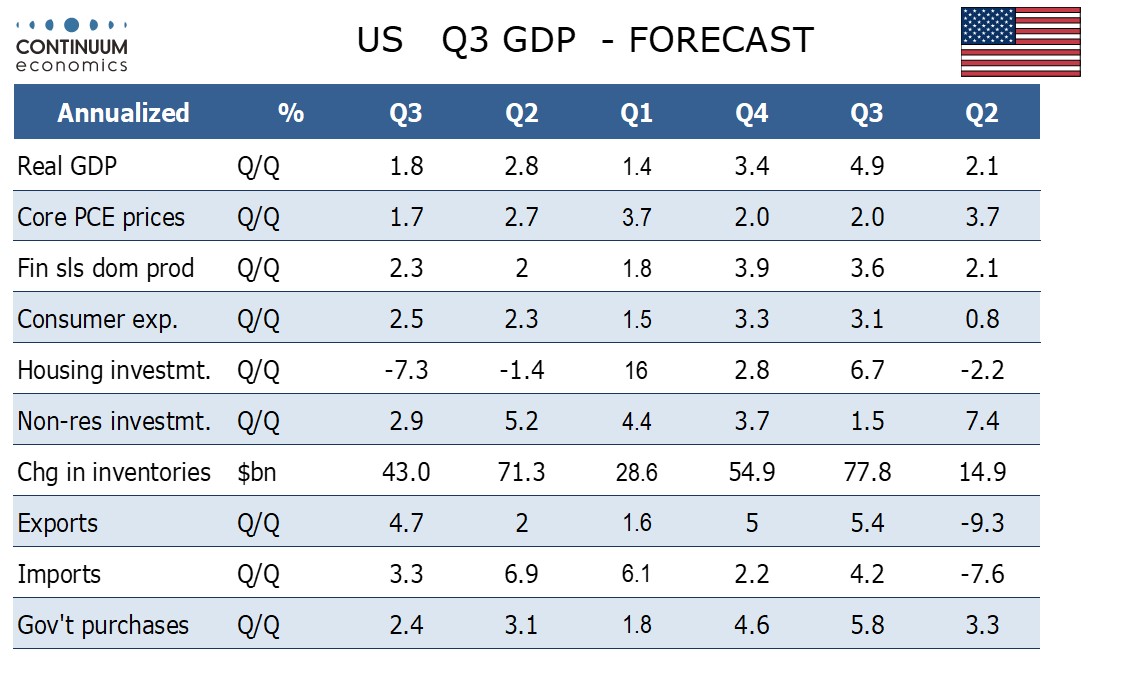
The stronger than expected 2.8% annualized increase in Q2 GDP contained some positive signals going forward, particularly retail sales and the trade balance showing stronger data in June to suggest momentum entering Q3. However a large Q2 inventory build up is a negative. We now look for Q3 to increase by 1.8% at an annualized pace, up from an estimate of 1.0% made before the Q2 data.
Not only were June retail sales stronger than expected, a June dip in auto sales was due to temporary computer outages and preliminary signals are for a sharp rebound in July auto sales. We expect Q3 consumer spending to rise by 2.5%, led by a 3.7% increase in durables.
 Also giving some support to the consumer is the prospect of real disposable income picking up from recent weakness as inflation falls. We expect a 2.0% increase in Q3, double the pace of Q2 and a five quarter high, though still below our projected increase in spending.
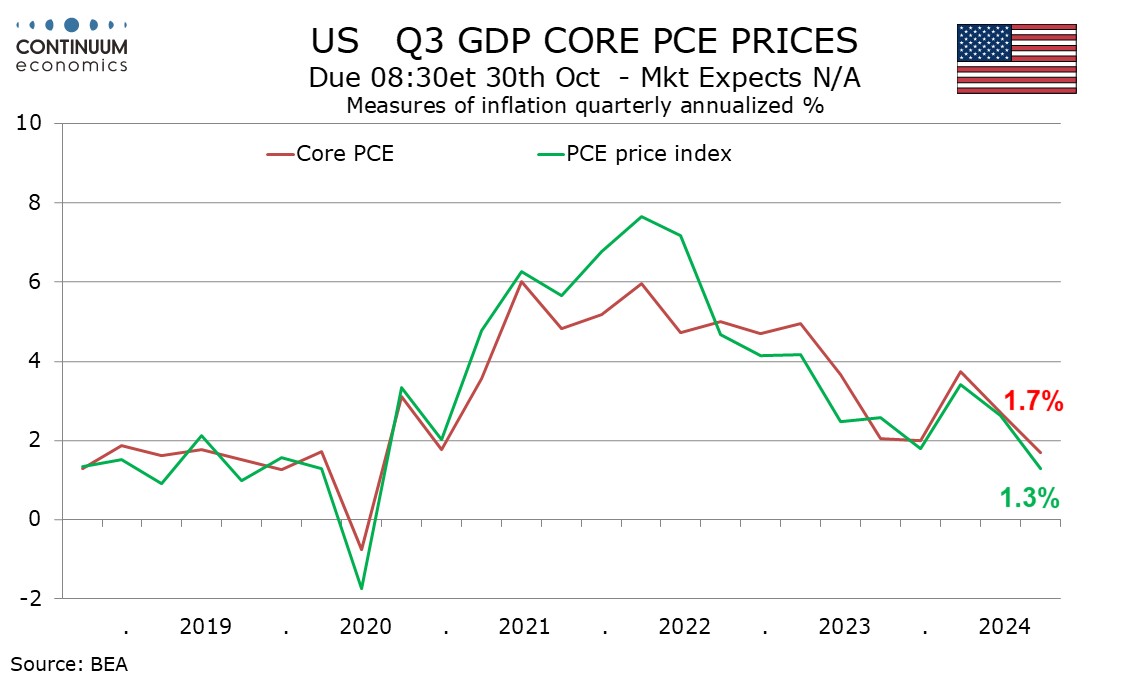
 We expect the recent slowing in inflation to persist through Q3, with annualized gains of 1.7% in core PCE prices and 1.3% in overall PCE prices. There appears to be some residual seasonality in the data. In 2023 core PCE prices rose by 2.0% annualized in Q3 and Q4. We expect the data to continue coming in softer than a year ago, though the second half of the year will understate the true inflationary picture.
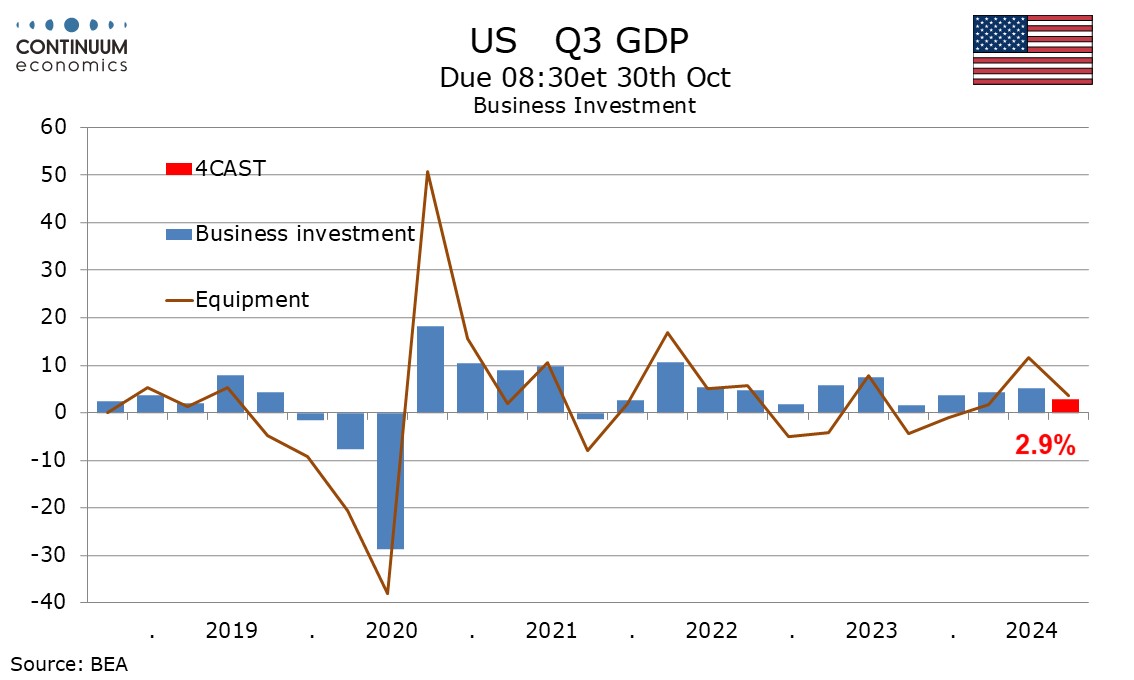
 A significant surprise in the Q2 GDP detail was a strong 11.6% bounce in investment in equipment explaining most of a 5.2% increase in business investment. Most of the bounce in equipment came in transport, which was correcting from three straight declines. We expect moderate gains in Q3, of 3.6% for equipment and 2.9% for business investment.
 We expect a significant negative of -7.3% from housing investment, after a marginal 1.4% dip in Q2 followed a 16.0% surge in Q1. We expect government to rise by 2.4%, slower than Q2’s 3.1% defense-led gain but stronger than a 1.8% rise in Q1 when defense was negative.
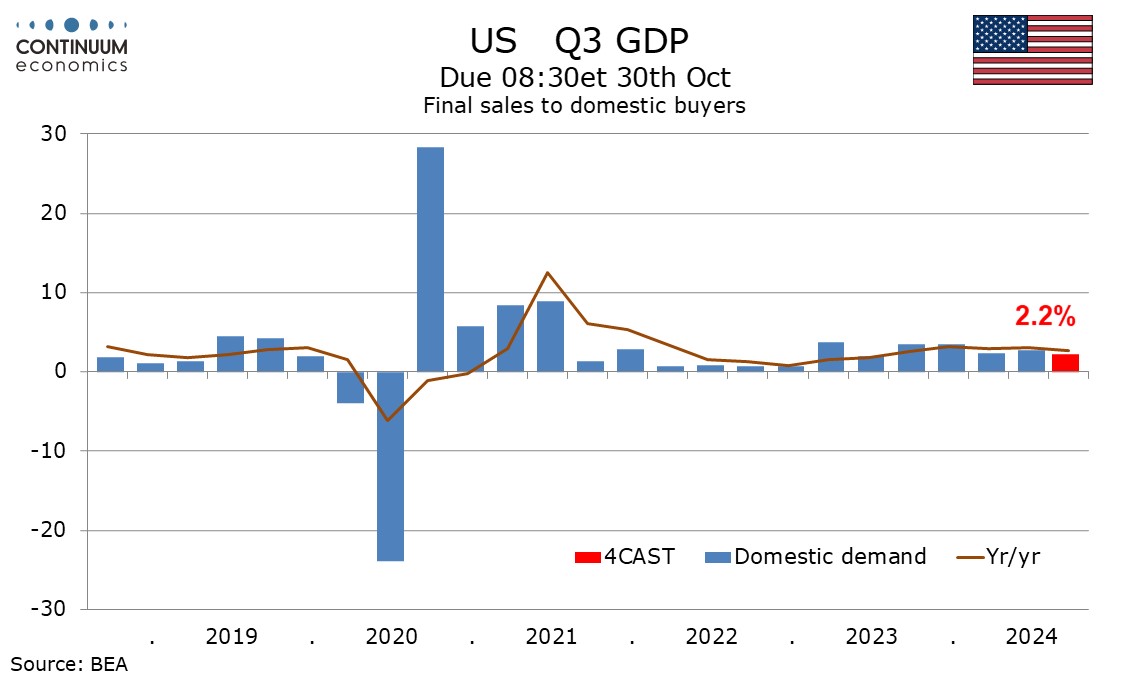 This will leave final sales to domestic buyers (GDP less inventories and net exports) up by 2.2% in Q3, slower than Q2’s 2.7% and Q1’s 2.4%, and well below the 3.5% gains in in Q3 and Q4 of 2023.We expect final sales (GDP less inventories) to rise by 2.1%, meaning a near neutral contribution from net exports after significant negatives in Q1 and Q2. A dip in June’s trade deficit is a constructive signal. We expect exports to rise by 4.7% in Q3 while imports rise by 3.3%, though in USD terms the gains will be similar.
 Slower import growth would be consistent with slower growth in inventories after a strong build up in Q2, much of which came from autos. We expect inventories to deduct 0.5% from Q3 GDP after adding 0.8% in Q4. Auto output explained 0.5% of Q2’s GDP increase, after being a negative in the three preceding quarters.