UK CPI Inflation Preview (Jun 19): Inflation Falls To Target?
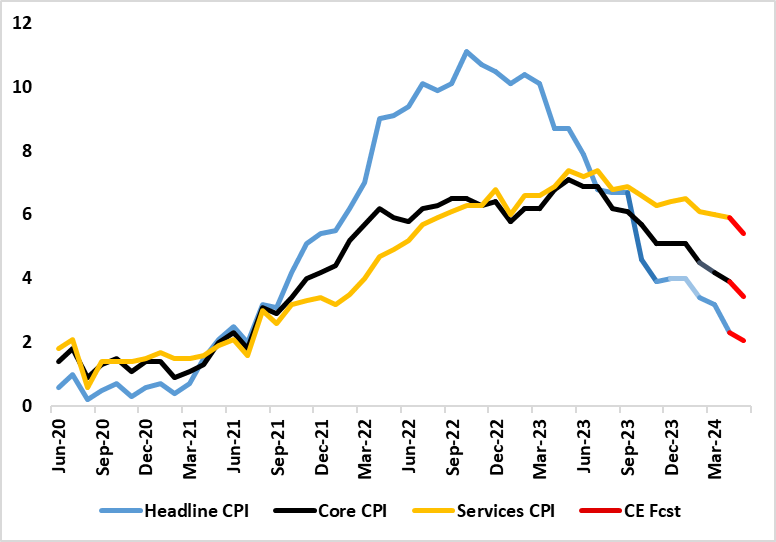
It is very clear that labor market and CPI data are crucial to BoE thinking about the timing and even the existence of any start to an easing cycle. But perhaps the CPI data is the most crucial especially with April’s signs of resilient services (and particularly in regard to eating out) very much questioning whether a rate cut from the MPC will come as soon as the verdict due on June 20. Markets think not but such a move cannot be ruled out after more soft labor market numbers and what may be more reassuring CPI data for May due the day before he MPC verdict. What the bar of acceptability is for the MPC in terms of the CPI picture is unclear; do they just have to hit the forecasts laid out in the recent Monetary Policy Report, or undershoot. As for the looming May numbers, helped by favourable base effects and a belated drop back in services, we see the headline down 0.2-0.3 ppt to 2.0-2.1% (the lowest since July 2021). Such an outcome would still be a notch above existing BoE forecasts, however.
Figure 1: Headline and Core Inflation Drop to Continue and Services Less Resilient?

Source: ONS, Continuum Economics
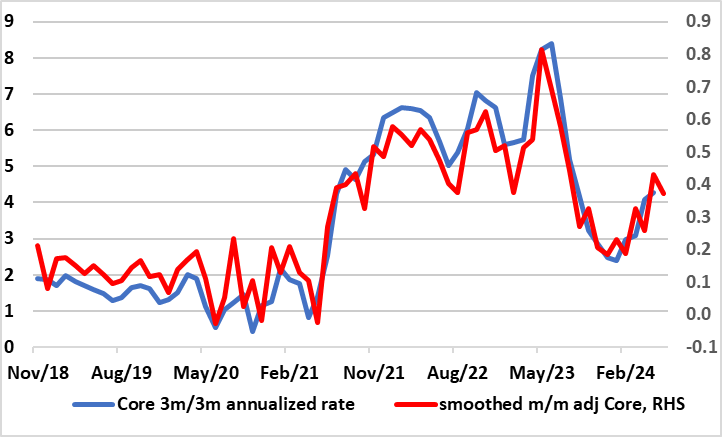
In addition, we see the core down 0.4 ppt to 3.4%, this outcome consistent with a m/m adjusted reading still above a rate consistent with target (Figure 2) but with some fresh slowing evident. This may be the case for services too where we see the y/y rate down to 5.4%, ie almost what the BoE thought and also consistent with some slowing in adjusted m/m terms.
The April outcomes exceeded BoE and consensus thinking the former envisaging the headline at 2.1% and services down to 5.5%. The April data was dominated by a drop in energy costs due a fall in the OFGEM energy cap, but this was partly offset by a rise in petrol costs and eating out. But despite base effects, and a drop in over half the 12 CPI main components, services inflation hardly buckled, a development highlighted by the fresh rise in restaurant inflation – often considered to be a leading indicator of persistent inflation swings. The question si to what degree this was an aberration, probably a result of the April hike in minimum wages
Figure 2: Adjusted Core CPI Pressures No Longer Falling?

Source: ONS, Continuum Economics, smoothed is 3 mth mov average
Notably, and as suggested above, these April data are only part of the inflation story that will unfold ahead of the next MPC decision. The BoE envisages the headline falling to a below-target 1.9% in May and services then down to 5.3%, numbers we now think a notch too low for the headline but are realistic for services, albeit where we also see a small rise back occurring in June – albeit solely for the headline though.
Policy Perspectives
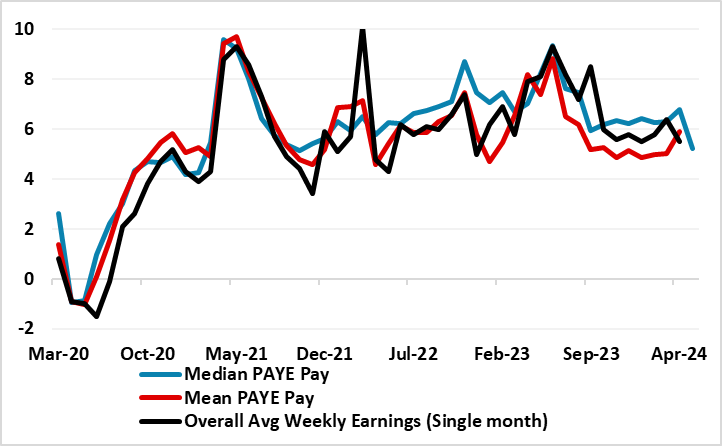
Regardless, context is needed. UK headline and core inflation have been on a clear downward trajectory in the last few months, the former having peaked above 10% in February last year and the latter at 7.1% In May. After a pause in the preceding three months, this downtrend seemingly resumed in the February CPI numbers and continued in March CPI data, albeit with more signs of resilient services inflation alongside additional hints that core inflation is also showing some resilience, at least in adjusted m/m numbers. This backdrop has made the BoE reassess the inflation outlook. Indeed, in last month’s MPR came two key MPC reassessments. Firstly, came an acknowledgement that the feed-though from the recent surge in import prices has occurred faster than previously assumed and thus is now likely to have less of a further potential inflationary impact ahead. Secondly, the BoE seems to think any second-round effects from high CPI inflation into wages may now fade faster than previously thought, this backed up by its own survey data suggesting companies are becoming less able to pass on higher costs to consumers. All of which helps explain the overall greater overall BoE confidence in a softer inflation outlook and with risks much more balanced. But this latest data may only harden clear splits evident within the MPC, albeit possibly drawing reassurance from softer wage numbers, most notably median pay in HMRC numbers (Figure 3).
Figure 3: Pay Pressures er Falling?

Source: ONS