EZ HICP Preview (May 31): Core Disinflation Continues?

Very much having affected ECB thinking, there has been repeated positive EZ news in the form of falling EZ HICP inflation and somewhat broadly so. This abated in April, with the headline staying at 2.4% but with the core down a further 0.2 ppt to a 27-mth low of 2.7%, as higher fuel prices were offset by some belated correction back in services inflation related to the early Easter distortion (Figure 1). But this latter figure may still be troubling to some Council members’ worries about aspects of price resilience not least as monthly adjusted numbers have also shown some such resilience, if not revival, notably on a core basis and this continued in the April data even given the fall in the y/y services inflation rate. But despite an energy-induced rise in the headline rate we expect to see for May data, the core rate may drop another notch as may services inflation, with m/m adjusted data also painting a softer picture (Figure 2), possibly reflecting easier wage pressures (Figure 3).
Figure 1: Higher Headline and Lower Core Inflation?
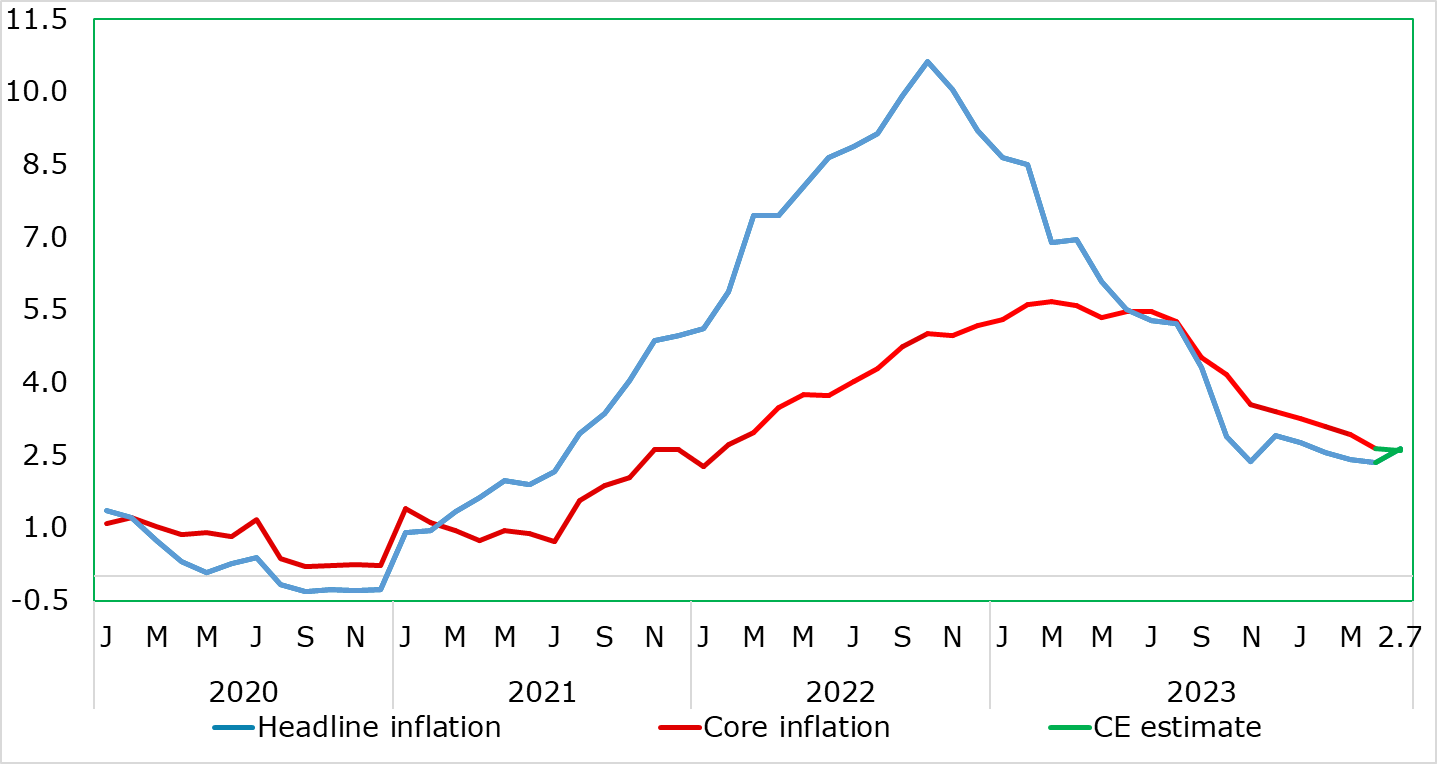
Source: Eurostat, CE, % chg y/y
Indeed, and somewhat disappointedly, the March fall in the core did not encompass more discernibly softer y/y services inflation, its rate stuck at 4.0% for a fifth month running. This changed decisively in April numbers with services inflation down to 3.7%, a 21-mth low, this though more due to base effects than a genuine underlying drop. Energy inflation was less negative (partly due to higher petrol costs) while processed food prices rose afresh, probably related to the timing of Easter
Figure 2: Smoothed Core m/m Price Pressures Running Below Target Again?
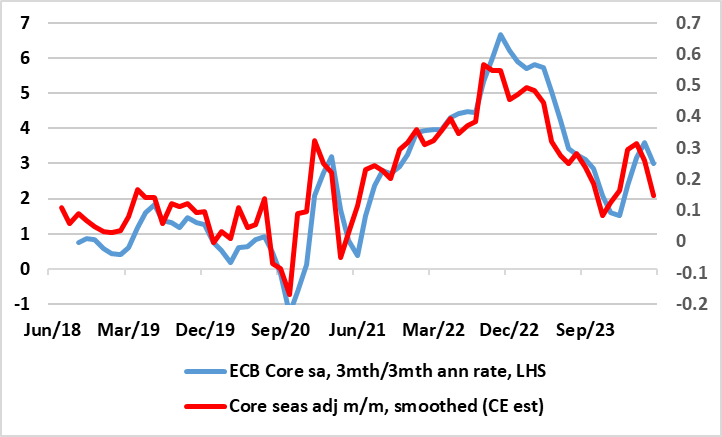
Source: ECB, CE
As for underlying trends, it is notable that the ECB has been somewhat troubled by the failure of services inflation to have fallen in the last few months, and its apparent stability in m/m adjusted terms may harden some of the hawks worries about aspects of price resilience as may monthly adjusted core numbers (Figure 2) which have also shown some such resilience, if not revival. But this may change in the May data. Despite an energy induced rise in the headline (largely a reflection of base effects due to the introduction of the “Deutschlandticket” a year ago), the core rate may ease 0.1 ppt as may services inflation, this actually indicative of both showing clearly softer pressures in m/m adjusted terms. Nonetheless, the data do not make the case for rapid ECB easing any greater; we still see three 25 bp cuts this year with a move in June very much on the cards, especially given wage data (compiled by Indeed) which has pointed to a clear and further easing in such cost pressures (Figure 3), actually more clearly than the ECB had anticipated.
Figure 3: Wage Pressures Easing?
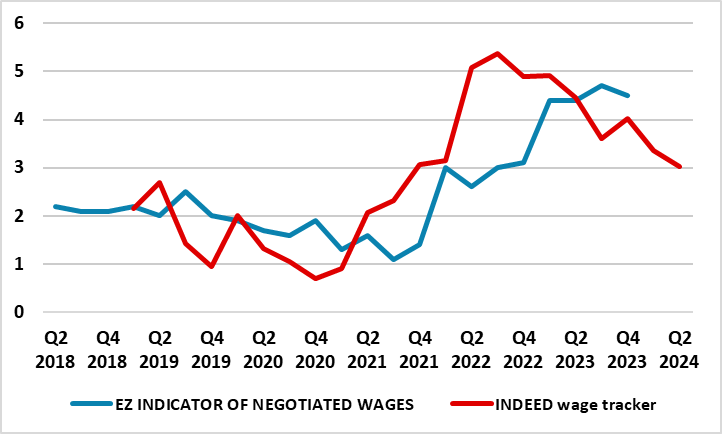
Source: ECB, CE, Bloomberg, % chg y/y
Below-Target Inflation Looming in H2
Regardless, and no encompassing a slight fall back in oil prices of late, we still envisage that the headline slip below target temporarily in late-summer 2024, well over a year earlier than the ECB currently envisages officially, and then undershoot more durably through 2025, while the core should continue to fall in the interim regardless. Indeed, there are ever-clearer signs of soft underlying inflation at least in terms of non-energy goods. This soft(er) underlying adjusted price picture is evident too in the adjusted data used by the likes of Chief Economist Lane, albeit on a slightly different measurement basis, using 3mth on 3mth changes rather than the three month m/m moving average we prefer for its slightly greater topicality (Figure 2). But notably ECB Chief Economist Lane has very much underscored that the Persistent and Common Component of Inflation was the best predictor of inflation one and two years ahead and that this had eased to 2% of late and stayed there.