Eurozone Data Review: Less Weak But Soft Domestic Demand Taking Less Toll on Core Inflation?

According to revised official national accounts data, the EZ economy was in recession in H2 last year, albeit modestly so and against a backdrop of marked, if not increasing, national growth divergences. This geographical variation continued into Q1 (Figure 1) where the flash GDP reading exceeded expectations, albeit far from being too surprising. Indeed, GDP rose by 0.3% q/q, three times the ECB estimate and where even in Germany there was a return to positive growth. Indeed, real GDP may have been bolstered afresh by weaker imports, working day effects and unseasonable weather and where what was still a weak consumer backdrop in Q1, these hardly a result of improving fundamentals. The weakness in domestic demand persisted, this possibly helping add to the downside HICP core rate seen in the April flash to a 32-mth low. As a result, we would not read too much into any apparent ‘strength’ in the Q1 GDP numbers and, it is unlikely to sway ECB thinking which is currently more dominated by price developments and where the balance of recent outcomes still pointst to further falls into H2 .
Figure 1: Divergent Q1 EZ GDP Picture
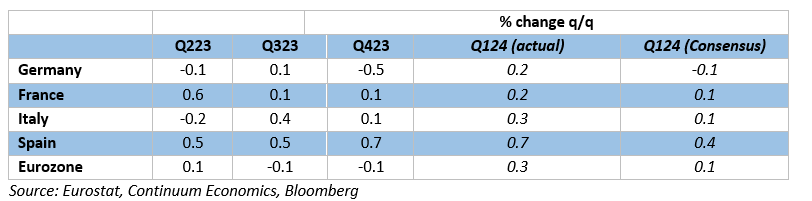
Geographical Disparity?
Overall the now small q/q drop in H2 2023 EZ GDP reading was below ECB thinking but this reflected marked divergences among the EZ economies, most notably among the ‘Big 4’ and this continued into Q1. Spanish GDP growth picked up to a revised 0.7% q/q continuing a very solid and relatively balanced path seen of late. In contrast, the German economy sank a revised 0.5% in Q4 but recovered in Q1. But the fact that last quarter all of the Big 4 retuned to growth, and where actual strength was again evident in Spain, the question is whether such apparent resilience may possibly provide the Council with a little less urgency, this activity backdrop (where the Q1 economy may rose just 0.4% in y/y terms) will have little impact on ECB thinking,. Regardless there are some better (at least less adverse) real economy signs, some implying recovering activity, the question being the extent to which ECB tightening has yet to deliver anything like its full impact on demand and could thus stamp on these alleged green shoots.
Such a backdrop may reassure some Council members who may still be wary that the ECB’s recently downgraded growth forecasts are still too optimistic, they taking much from the improved PMI readings seen through Q1 and into the early part of this quarter. But we remain wary of the messages from the composite PMI, not least given the misleading picture it has offered in the past regarding actual EZ GDP swings an d its conflict with other survey data (Figure 2). This may be partly a result of its limited geographical coverage and its lack of account of the construction, retail and government sector readings – all volatile but also very rate sensitive. Indeed, the broader based European Commission business and consumer survey data is telling a much different story, having slipped afresh and remains much more with contraction territory. In addition, the weakness in domestic demand (most notable in the form a fresh drop in Italy and seemingly still in Germany) is important as it accentuates the disinflation backdrop still coming through.
Policy Tightening Still Filtering Through
Thus we remain of the view that the ECB is still too optimistic regarding real economy prospects, even though our upgraded 2024 GDP estimate of 0.5% is just a notch below central bank thinking, but where we see the official 1.5% 2025 projection being undershot.. This reflects not least as nowhere near the full extent of its policy tightening has filtered through yet, this formal hiking being accentuated both by the ECB balance sheet shrinkage and by credit standards being raised by the banking sector. But the ECB has been very aware of a still very weak credit and bank deposit backdrop, this very much underscored in the recent bank lending survey (BLS). Indeed, the BLS was explicit in highlighting that the shrinkage in the ECB monetary policy asset portfolio had a further negative impact on banks’ financing conditions and liquidity position, resulting in a moderate tightening of terms and conditions and a negative effect on lending volumes.
Figure 2: PMI Surveys Contrast with Alternative Business Surveys
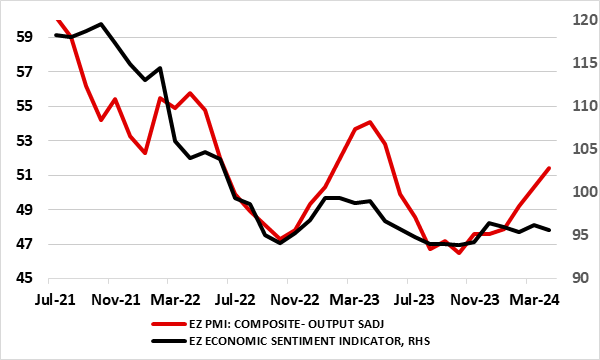
Source: Markit, European Commission
Flash GDP in Perspective
Amid a paucity of reliable data, there are some more positive signs for the last quarter. Admittedly, it may be more the impact of unseasonable weather (very cold in north Europe and mild to unusually warm elsewhere) which accounts for the solid growth posted in early Q1 figures in services and particularly construction sectors – NB: services production data is a recent Eurostat innovation. And there are some downside risks too, such as what may be widespread fiscal consolidation, this possibly already evident in what may be contracting Italian consumer spending.
Otherwise, and as we have underlined before, it is important to recognize that there are clear shortcomings to the flash estimate for EZ GDP. No details comes with these flashes and they are prone to clear revisions. Indeed, the original Q3 and Q1 GDP numbers gave a clearly misleading impression, in that they implied initially modest growth in both quarters. Then Q2 GDP was initially recorded at 0.3%, only to be revised back as well, the same fate besetting the Q3 numbers too. Time will tell whether the Q1 flash numbers will tell any more authoritative a story! Regardless, the apparent resilience in overall GDP makes the sharp and broad fall in inflation all the more likely to have been driven more by supply factors than demand. But with demand likely to buckle or at least be constrained by policy tightening the disinflation process may have much further to run.
Figure 3: Core Inflation No Longer Falling?
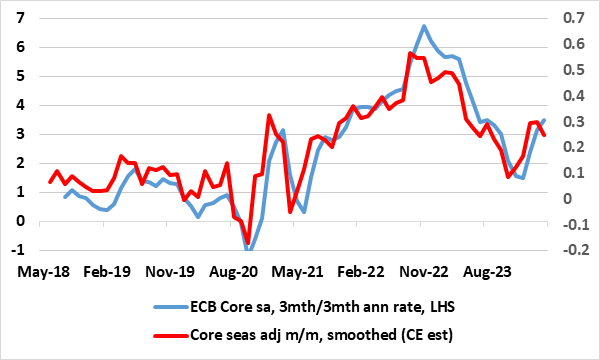
Source: Eurostat, CE
No New Inflation Insights
Very much having affected ECB thinking, there has been repeated positive EZ news in the form of falling EZ HICP inflation and somewhat broadly so. This continued in the March HICP numbers, with the 0.2 ppt drops in both headline and core being a notch more sizeable than most anticipated. Regardless, the headline, at 2.4%, continued its recent decline although the latest core (2.9%) meant that the ECB Q1 projection of 3.0% was exceeded by 0.1 ppt. Notably, the headline staying put in April but with the core down a further 0.2 ppt to a 27-mth low (Figure 3), as higher fuel prices were offset by some belated correction back in services inflation related to the early Easter distortion. But this latter figure may still be troubling to some Council members’ worries about aspects of price resilience not least as monthly adjusted numbers (Figure 2) have also shown some such resilience, if not revival, notably on a core basis and this continued in the April data even given the fall in the y/y services inflation rate. The thrust of today’s GDP and HICP data do not make the case for rapid ECB easing any greater; we still see three 25 bp cuts this year even with headline HICP falling below target in H2.