EZ HICP Preview (Apr 30): Core Disinflation Signs to Flatten Out Further?

Very much having affected ECB thinking, there has been repeated positive EZ news in the form of falling EZ HICP inflation and somewhat broadly so. This continued in the March HICP numbers, with the 0.2 ppt drops in both headline and core being a notch more sizeable than most anticipated. Regardless, the headline, at 2.4%, continued its recent decline although the latest core (2.9%) meant that the ECB Q1 projection of 3.0% was exceeded by 0.1 ppt. We see the headline staying put in April but with the core down a further 0.2 ppt (Figure 1), as higher fuel prices are offset by some belated correction back in services inflation related to the early Easter distortion.
Indeed, and somewhat disappointedly, the March fall in the core did not encompass more discernibly softer y/y services inflation, its rate stuck at 4.0% for a fifth month running. This is notable as the ECB has been somewhat troubled by the failure of services inflation to have fallen in the last few months, and its apparent stability may harden some of the hawks worries about aspects of price resilience not least as monthly adjusted numbers (Figure 2) have also shown some such resilience, if not revival, notably on a core basis and this may continue in the April data even on the basis of a clear fall in the y/y services inflation rate. The data do not make the case for rapid ECB easing any greater; we still see three 25 bp cuts this year.
Figure 1: Stable Headline and Lower Core Inflation?
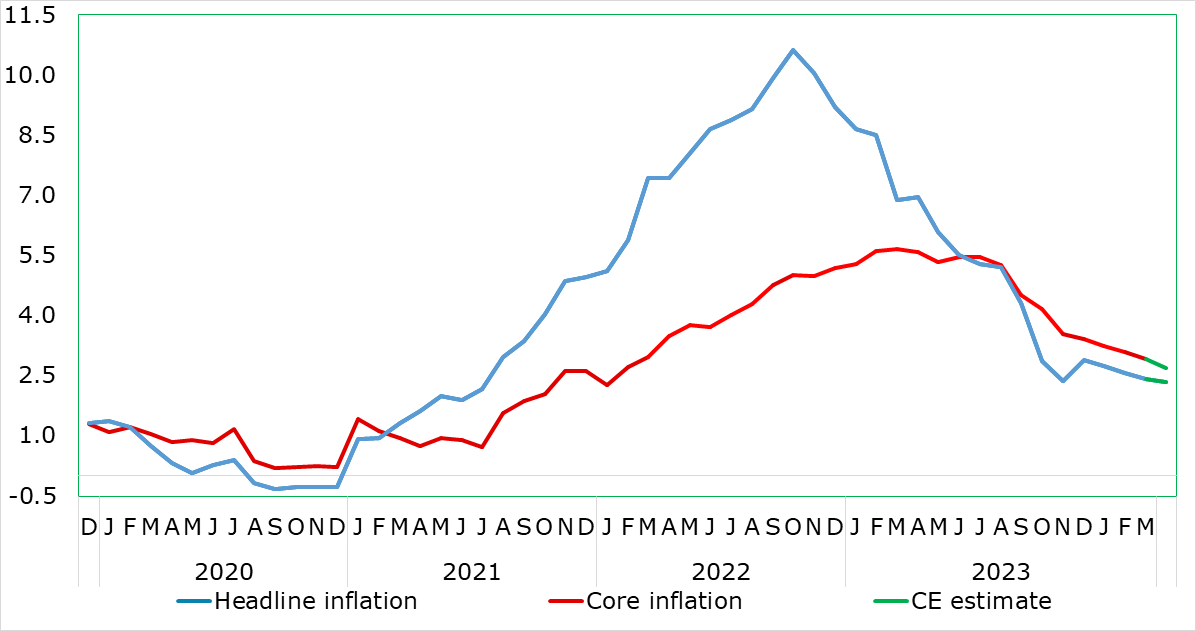
Source: Eurostat, CE
Below-Target Inflation Looming in H2 Despite Hitherto Resilient Services
Dominated by a further fall in food inflation, March saw services stay at 4.0% in y/y terms, but with core goods helping take the core down in turn. The upside risks from fuel prices and from rents/eating out may also have been behind the slightly firmer than expected services numbers. Regardless, possibly encompassing added volatility from the early Easter this year, and despite the rise in oil prices of late, we still envisage that the headline now hit target us in late-summer 2024, well over a year earlier than the ECB envisages, and then undershoot through 2025, while the core should continue to fall in the interim regardless.
There are ever-clearer signs of soft underlying inflation at least in terms of non-energy goods and also in terms of persistent price pressures which are now running around the 2% target both on an overall basis and also for core measures. However, there are signs that such underlying measures have stopped falling (Figure 2), not least on the ECB’s preferred short-term inflation indicator. Moreover, services inflation has not fallen in y/y terms, a stability seen in seasonally adjusted m/m numbers, the question is whether this is true price persistence linked to high wages or reflection of one-off factors such as indirect tax moves. At this juncture, this is still something we think this is more noise than fresh trend but will continue to monitor closely.
Figure 2: Adjusted m/m Core Price Pressures No Longer Falling?
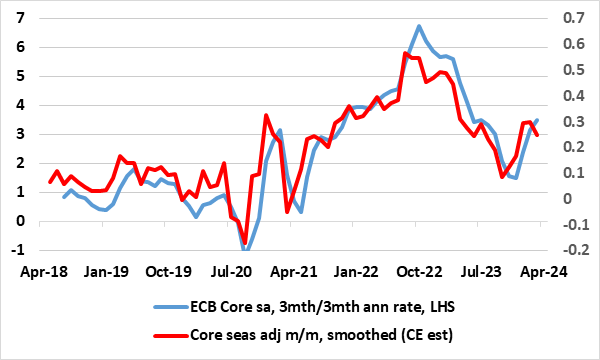
Source: ECB, CE
Gauging Underlying Price Dynamics
Regardless, as a result of the March HICP data, the core rate is down over two ppt in the last six months. But this disguises an even clearer fall in recent price dynamics, as seen in m/m seasonally adjusted data (Figure 2), and with the smoothed core rate now consistent with target, but possibly less consistent with the undershoot hinted at in previous months. This more mixed underlying adjusted price picture is evident too in the adjusted data used by the likes of Chief Economist Lane, albeit on a slightly different measurement basis, using 3mth on 3mth changes rather than the 3 month m/m moving average we prefer for its slightly greater topicality (Figure 2). But notably ECB Chief Economist Lane has very much underscored that the Persistent and Common Component of Inflation was the best predictor of inflation one and two years ahead and that this had eased to 2% of late and stayed there. Given its correlation with (easing) global supply pressures, the former’s fall may yet resume and to rates below 2% (Figure 3). The question is whether other data do add to the case for easier monetary policy, given softer European Commission survey data (conflicting with less downbeat PMI messages) and fresh signs of actual falls in credit as signalled by bank lending surveys.
Figure 3: Persistent Price Pressures Have Ebbed
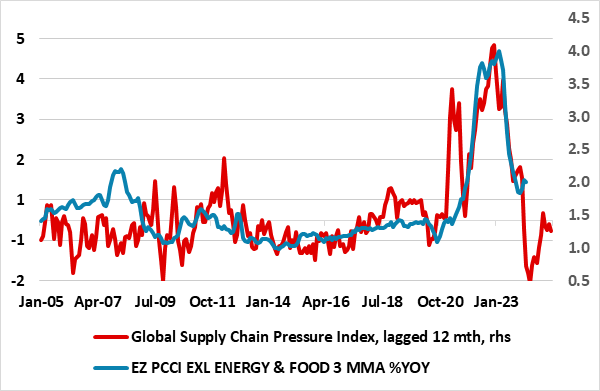
Source: ECB, New York Fed, Continuum Economics, PCCI is Persistent and Common Component of Inflation