UK CPI Inflation Review: Headline and Core Steady But Softer Underlying Pressures Evident
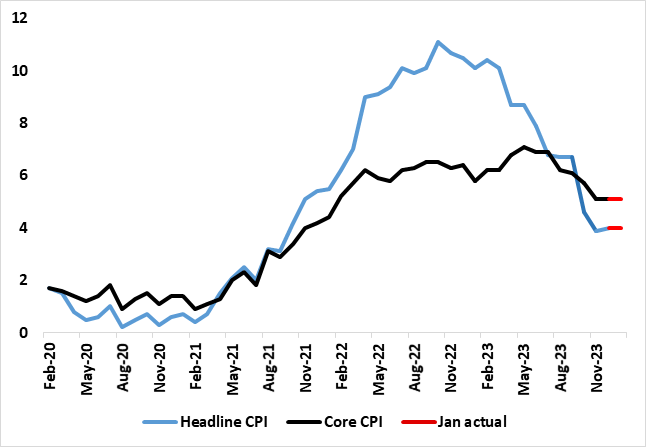
Superimposed over both upside and downside surprises, UK headline and core inflation have been on a clear downward trajectory in the last few months the former having peaked above 10% in February and the latter at 7.1% In May. However, this trend surprisingly stalled in December as the headline rate rose a notch to 4.0%, up from a 27-month low of 3.9%, the first rise in 10 months (Figure 1) and where the core rate remained at 5.1%, still a 23-month low. As we envisaged, both the headline and core were unchanged in the January data (thereby a little below consensus and BoE thinking) with services inflation boosted by adverse base effects around airfares but this being offset by lower food and non-energy goods price pressures (developments that chime with BRC survey numbers) as well as further falls in petrol prices. Notably, the data hint at fresh services disinflation, even on the adjusted measure that the BoE has started to acknowledge.
Figure 1: Headline and Core Inflation Drop Stalls Again

Source: ONS, Continuum Economics
The stable January data came alongside clearly soft PPI data at least for manufacturing. As for the CPI numbers the headline rose by 4.0% y/y in January, the same rate as in December 2023. The largest upward contribution to the monthly change came from housing and household services (principally higher gas and electricity charges), while the largest downward contribution came from furniture and household goods, and food and non-alcoholic beverages, the latter saw the first m/m fall in since September 2021, and the largest fall since July 2021. Core CPI (excluding energy, food, alcohol and tobacco) rose by 5.1% in the 12 months to January 2024, the same rate as in December 2023; the CPI goods annual rate slowed from 1.9% to 1.8%, while the CPI services annual rate increased from 6.4% to 6.5% due to base effects.
The headline rate was still some 0.1 ppt below formal BoE thinking and is clearly a reassurance not least as all but three of the 12 main components saw a fresh drop and where our estimate of the seasonally adjusted data saw something of a return to clear disinflation trend seen in months prior to December. Indeed, on this basis, CPI core inflation is within the 2% target!
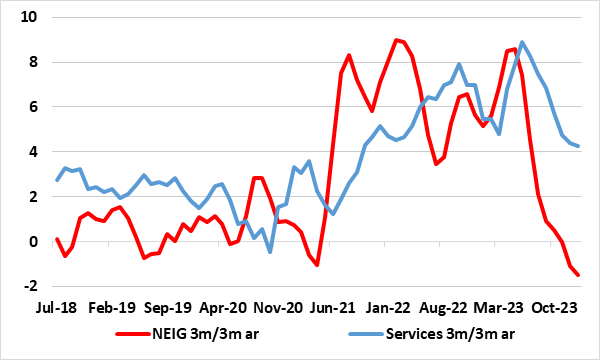
The CPI data have been perturbing for the BoE hawks and hence their demand to see more data to assess how sizeable and durable the current disinflation process actually is. But despite official labor market revisions showing higher inactivity, the numbers still show wages data softness which the BoE majority should view in tempering its worries about persistent price pressures, especially if also presented on such an adjusted m/m basis. As for adjusted data, the hawks have started to examine seasonally adjusted data (albeit looking at a 3 mth /3 mth basis rather than the 3 mth moving average we prefer as the latter is more topical).
Figure 2: Adjusted Core CPI Pressures Falling Broadly Even on BoE Measure?

Source: ONS, Continuum Economics, ar is annualized rate
MPC members such as Catherine Mann have highlighted the manner in which core goods inflation (Non-energy industrial goods, or NEIG) have fallen but services have been more resilience. In these CPI figures, the former weakened further on a 3 mth /3 mth basis with more disinflation signalled by the weaker PPI numbers. But as Figure 2 shows, services inflation, which the hawks have suggested has been more resilient, also showed more signs of disinflation. Overall, the data are very much consistent with continued and broad-based disinflation and somewhat faster than BoE thinking.