UK Housing – Cracks Still Evident, as Transactions Sink
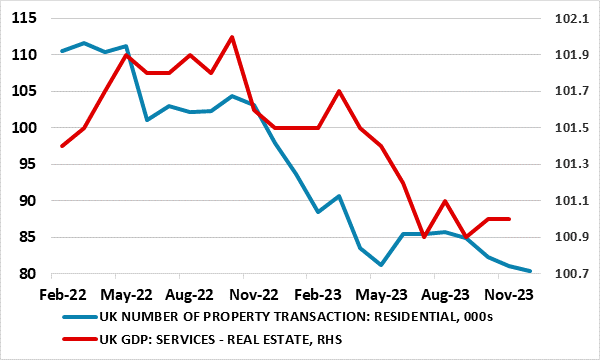
As mortgage rates have started to fall and recent house price data show somewhat unexpected resilience if not gains, there is increasing speculation that the worst is over the for UK housing market. Regardless, with over half of mortgage holders yet to feel the hits from BoE hikes we feel this view is somewhat complacent. Admittedly, house price falls in the coming year may be no higher than mid-single figures, if at all, meaning that the economic fallout via wealth effects may be small. But this apparent resilience is more a result of supply factors, related to rigidities in the housing market related to relative house price moves rather than sustained demand increases and is evident in ever weaker housing market transactions. Indeed, transactions have plunged in the last year and this weighs directly on GDP growth (Figure 1) with real estate activities contributing some 13% of the real economy. We are wary that this will fall possibly somewhat further and caution against assessing the housing backdrop purely in terms of prices.
Figure 1: Slumping Property Transactions Weigh on GDP

Source: HMRC, ONS
The Housing ‘Shortage’ in Perspective
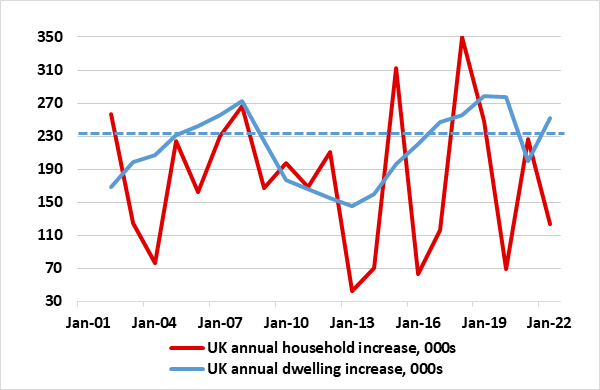
It is repeatedly reported that there is shortage of UK properties. As the RICS underlined in its latest house price survey, current stock levels remain relatively low when viewed in a longer term historical comparison (inventory levels of homes available for sale per surveyor per branch are well below the long-term average). But this does not mean that there is actually a shortage of houses, apartments or overall dwellings. Indeed, there are some 30 mln overall dwellings in the UK at present (ie supply), some 2 mln more than the amount of households (ie demand). Moreover, as Figure 2 highlights the annual change in the stock of dwellings has exceeded the growth of households in most years.
However, this is of course a gross over-simplification. Some of this dwelling stock is too dilapidated for use; in unattractive areas and away from vital infrastructure. Reflecting this data for England alone suggest there is nearly 0.7 mln vacant properties, many so a long-term basis. But we would suggest there is a growing factor that is reducing the effective supply of property for sale – the ability and willingness of some homeowners to put their property on the market.
Figure 2: House Demand Lags Supply

Source, Land Registry - dashed lines represent long-term averages
To some extent this reflects the marked rise in mortgage rates that many homeowners face (some one third of owner occupiers have mortgages). Admittedly, the ensuing rise in debt servicing has caused financial strains, albeit not to an extent that is led to what has previously been called distress selling. This may reflect authoritative stress testing by lenders in the past. When borrowers enter a fixed-rate mortgage, lenders test whether they could continue to afford their mortgage if interest rates were to increase by the time it comes to re-fix. Even though over the last two years, mortgage rates have increased by over four percentage points, raising the cost of repayments for those re-fixing, research by the BoE finds that the vast majority of borrowers who came to the end of their fixed terms in 2023 faced new mortgage rates which were lower than those they had been ‘stressed’ at. But this does not mean these borrowers can afford to increase the size of the mortgage in order to trade up the housing ladder and may still face difficulty servicing existing debt, not least given the cost of living shock.
Moreover the ability of many first time buyers to trade up has effectively been reduced by the marked and seemingly structural changes that have occurred in the UK housing market since the pandemic
Reverberations from the Pandemic…
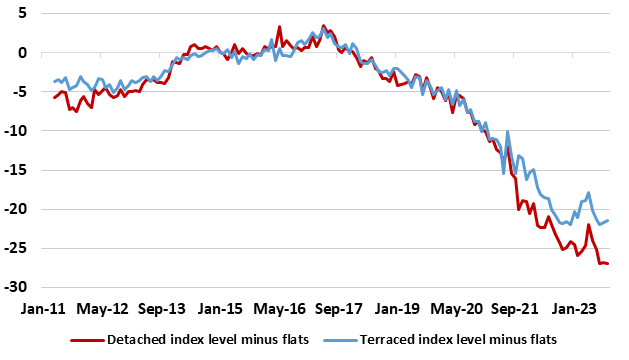
Instead, stronger forces have been at play within the housing market over the past few years, many of which stem directly from the unprecedented impact of the pandemic itself. Most notable have been changing housing preferences linked to a greater ability and affinity from working from home that helps explain why house price inflation has picked up more outside of major urban areas as households seek more space. This has also affected the relative growth in the type of properties, with higher value (semi and detached) seeing much faster prices rise than terraces and apartments, this very much increasing the cost differentials between the former and the latter and a clear shift in the opposite direction prior to the pandemic. Indeed, as Figure 3 illustrates, the rate at which apartment prices have fallen relative to detached and even terraced dwellings is historically high, this being all the more important as 22% of all UK dwelling are apartments and they are usually the first step on the housing ladder for any first-time buyer. In other words, these first-time buyers, often apartment owners, have little ability to trade up as relative prices swings have made this aspiration much more difficult, merely accentuating what were already clear affordability constraints.
It is well known that the average homebuyer today needs to be much more affluent than in the 1980s and 1990s. This has caused a significant shift in affordability and also added to the difficulties faced by many aspiring buyers and owner-occupiers to access mortgage finance in the face of steepening house price to income ratios. Indeed, a reduced ability to trade up has meant that many owner-occupiers have been forced to stay put, this acting to reduce the supply of homes placed on the market. The hope will be that relative prices may start to swing back as demand focuses on these relatively cheaper apartments, but the data so far us far from clear that this is happening.
... Still Inhibiting Supply?
And as suggested above, all of this has been accompanied by the swing from ultra-low interest rates accentuated by competition among mortgage providers to the BoE actions in the last year both in terms of conventional policy and QE. But we would also argue that this effective shortage of properties has accentuated the pick-up in house prices, this a result partly at least from the rise in prices itself.
Figure 3: Relative Price Swings in Property Types Hurt Apartment Owners

Source: Land Registry, cumulative % chg
Assessing the housing market purely in terms of prices misses the point as the volume of transactions is just as important both as a bellwether and a factor affecting the wider economy. Indeed, the housing market may be better described as less a recovery but more where supply and demand are moving further apart. But it also means that the despite the strength in house prices, the housing market is not boosting the economy, the very opposite. Admittedly, rising prices will increase household wealth, but this is more likely to affect the already wealthy and older, who have a lower predisposition to spend. It also means that a larger share of the household savings build may be fritted way into the housing market than into consumer spending.