Commodities Outlook: Markets in Motion
OPEC+ has entered a new supply cycle, gradually reversing a second layer of voluntary cuts. The latest 1.65 mln b/d tranche is being phased out at 137,000 b/d monthly, likely completed by September 2026, while 2 mln b/d of group-wide cuts remain until the end of 2026. Non-OPEC supply growth will likely slow in 2026 and it would be led by the Americas. Demand faces mixed drivers: modest support from Fed easing, China’s stockpiling, and emerging markets, offset by weak OECD growth. We forecast WTI at USD 60 by end-2025 and at USD 53 by end-2026.
Copper demand in the U.S. is expected to remain modest as buyers work through inventories built in anticipation of tariffs; though AI-driven data center growth and potential Fed easing could support consumption by late 2026. Accounting for more than half of global copper demand, China faces headwinds from inventory destocking, a sluggish property sector, and export restrictions, while supportive factors include high-tech manufacturing growth and a weaker U.S. dollar. Global supply growth is moderate, constrained by aging mines and operational risks, supporting prices at USD 9,500 by end-2025 and USD 9,800 by end-2026.
Gold has surged 43% year-to-date, driven primarily by demand factors rather than supply. Central bank purchases have remained a cornerstone, supporting diversification and hedging against inflation and U.S. dollar risk. Investment demand, via ETFs, has also been strong, though inflows may moderate in 2026 as capital shifts toward bonds amid relatively high yields. In China, a weaker U.S. dollar and potential equity market corrections could sustain gold demand and investment. We forecast gold at USD 3,600 by end-2025 and USD 3,700 by end-2026.
Oil: OPEC+ playing offensive
A new cycle in oil market supply has now consolidated. This cycle began in October 2024, following the reversal of the 2.2 mln b/d voluntary production cuts announced in November 2023. The unwinding of these cuts was completed in September 2025, after which OPEC+ took the unexpected step of gradually reversing a second round of voluntary cuts, amounting to 1.65 mln b/d, that had been introduced in April 2023 and will begin to be phased out in October. We view this shift as a structural adjustment.
A number of factors have contributed to OPEC’s policy shift. First, the group seeks to reclaim market share; for instance, OPEC’s share of crude oil production is expected to decrease from 39% in 2017 to 35% in 2026, according to the Energy Information Administration (Figure 1). Second, although prices are down 12% year-to-date (as of mid-September), the increase in output has not pushed oil below USD 50 – a level we view as a potential breaking point. Third, the announced reversal of production cuts does not translate into an immediate equivalent increase in supply, owing to i) compensation requirements and ii) capacity constraints in certain member countries. Indeed, spare capacity is concentrated in a small set of Gulf producers; whether countries beyond Saudi Arabia and the UAE provide the marginal barrels will determine the total effective supply growth. Moreover, compensation schedules and operational constraints mean that headline quota increases overstate near-term flows: OPEC has published member compensation plans that create offsets stretching into 2026.
Figure 1: Share of crude oil production
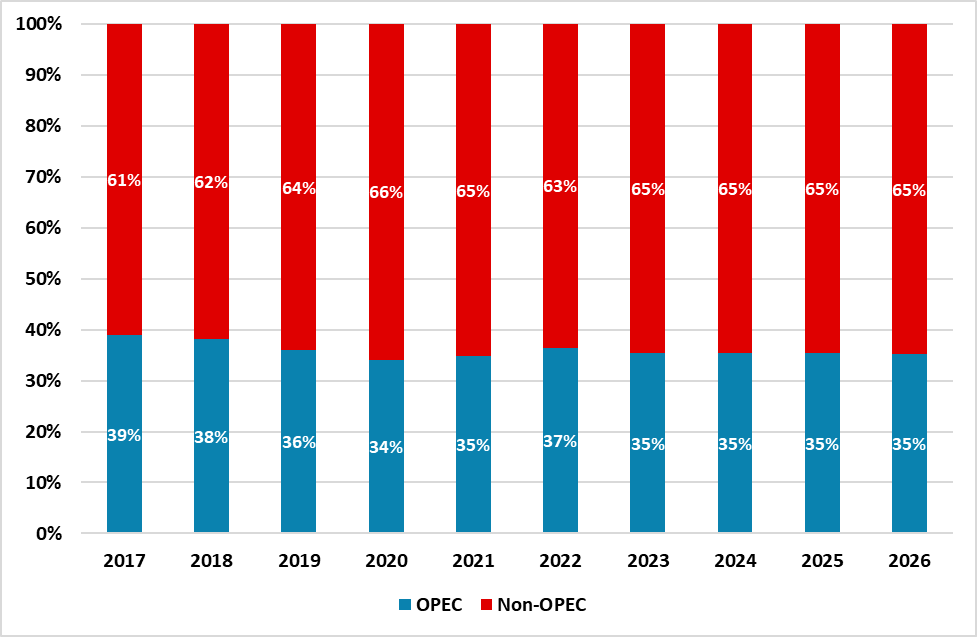
Source: EIA / Continuum Economics
In our baseline scenario, we expect the unwinding of the second layer of production cuts (1.65 mln b/d) to proceed at a pace of 137,000 b/d per month for the remainder of the year. Looking ahead, our central scenario for 2026 also assumes a continuation of production increases at the same rate, implying that this second tranche of cuts would be fully reversed by September 2026. An alternative scenario could materialize, involving a pause or even a reversal of the production hikes, should prices fall below USD 50 – though this is not our baseline. Regarding the remaining group-wide cuts of 2 mln b/d, which are scheduled to stay in place until the end of 2026, we expect them to hold as planned. A faster-than-anticipated unwinding of these barrels would be surprising, and we instead assume that they will likely be rolled back in 2027.
In terms of non-OPEC supply, growth is expected to continue in 2026, led primarily by producers in the Americas – most notably the U.S., Canada, Guyana, and Brazil. However, supply growth in these countries is set to fall behind that of previous years (0.8% in 2026 vs. 2.4% in 2025, according to EIA estimates). For instance, in the U.S., lower prices and reduced upstream investment could weaken output growth. In Brazil, gains will be tempered by project delays, infrastructure bottlenecks, and potential maintenance or regulatory constraints. In Guyana, output is set to continue growing although at a slower pace and could pick up in 2027 when the new developments in the Stabroek block – specifically the Yellowtail, Uaru, and Whiptail projects – reach full capacity.
For the remainder of 2025, the oil market is expected to experience moderate support, underpinned by a combination of macroeconomic and demand-side factors. Anticipation of consistent easing by the Fed could provide a modest boost to global oil demand by easing financial conditions, supporting economic activity, and improving sentiment. In addition, China’s recent stockpiling has boosted crude demand, reflecting an effort to capitalize on low prices. On the downside, the seasonal tailwinds that supported consumption over the summer are now fading.
Looking into 2026, the outlook for oil is one of modest growth. Fed’s rate cuts over the year could stimulate global economic activity and oil consumption modestly, as we expect growth below trend in the U.S., which coupled with weak OECD growth in Europe and Japan, mean that demand could fall short in a growing supply environment. In the U.S., it is also worth highlighting that policy reversals that weaken electric vehicle (EV) adoption may weigh on long-term energy transition trends. Consumer demand in China is threatened by uncertainty regarding employment and income growth; nevertheless, if the country continues taking advantage of low prices to build its inventories, this would provide solid support to crude – as it has over the past months. Emerging markets, particularly India, Southeast Asia, Africa, and the Middle East, are likely to remain key drivers of oil demand growth, reflecting ongoing industrialization and mobility trends. India passed China as the largest contributor to global oil demand growth in 2024, according to the International Energy Agency, responding to a rise in vehicle ownership as well as investments in refining and petrochemical infrastructure. However, these elements may be tempered by weaker fundamentals in developed economies. Overall, while 2026 offers potential for stronger demand from emerging markets, oil prices are likely to remain sensitive to both cyclical and policy-driven headwinds in the developed world.
We are marginally reducing our year-end 2025 forecast for WTI from USD 63 to USD 60, and for end-2026 we now expect prices to reach USD 53 instead of USD 58. Risks to our outlook include a deviation in OPEC+ policy from our baseline assumption – such as stopping or reversing the gradual return of barrels to the market. Additional geopolitical sanctions by the U.S. or Europe targeting Russian oil could also disrupt supply, though this is unlikely and such measures would possibly create room for other OPEC+ members to raise output. On the demand side, a sharper-than-expected slowdown in developed economies could generate a sizeable surplus, potentially sending prices below USD 50.
Copper: Structural pressures ahead
Demand in the U.S. during the first half of the year was largely influenced by President Donald Trump’s announcement of the possibility of imposing tariffs on copper. Indeed, this led to a large inventory rise in anticipation of the tariffs in the U.S., accompanied by a depletion of inventories elsewhere. Nevertheless, on July 30, it was announced that the tariffs would only apply to semi-finished copper products and copper-intensive derivative products, effectively excluding refined copper from the package. Following the announcement, copper prices sank over 20%.
As we reach the end of the year, we anticipate relatively low copper demand in the U.S., as buyers work through the stockpiles they built in recent months. Looking ahead, several forces will shape copper demand in 2026. On the supportive side, the rapid growth of data centers to support AI applications is an increasingly important source of copper demand; for instance, a McKinsey report (here) notes that, in the U.S., data center demand could grow by 20-25% per year through 2030. In addition, the Fed’s easing cycle could improve market sentiment and provide a potential feedthrough into the real economy – particularly via a recovery in construction activity – may further support copper demand, although this effect could kick in late in 2026 or 2027. On the downside, an overall weak U.S. economy and subdued macroeconomic sentiment could weigh on copper demand, especially as tariffs pass through to inflation or if the U.S. sees a mild recession (30% probability). Moreover, U.S. EV adoption has slowed due to high vehicle costs, limited affordable models, policy uncertainty, weaker incentives, insufficient charging infrastructure, and delays or scale-backs in certain EV projects by manufacturers, tempering the rapid growth seen in earlier years and keeping EV market share relatively flat at around 9-10%.
Undoubtedly, copper is highly sensitive to China’s demand, as the country accounts for over 50% of global consumption. Recently, much of China’s demand has been fueled by inventory accumulation rather than purely end-use consumption, suggesting that a destocking phase next year could translate into softer demand. Several factors influence demand in opposing directions. On the positive side, AI and high-tech manufacturing continue to support copper consumption, driven by government initiatives aimed at advancing these sectors. Another contributing element is expectations of a weaker U.S. dollar, which would make the metal relatively cheaper. Trade-in programs for home appliances, which rely on copper, have historically supported demand, although they may have already reached a peak. On the negative side, the property sector, which has traditionally been a major driver of copper demand in China, remains weak. Additionally, China is likely to face increasing challenges in exporting its products due to tariffs, regulatory changes, and other restrictions in key international markets such as the U.S. and Europe; particularly, if these measures target copper-intensive products, they could weigh on copper consumption.
The International Copper Study Group estimates copper mine production to increase by 2.5% in 2026 and for refined copper production to grow by 1.5% next year. The organization sees support from a series of smaller expansions and the start-up of a number of small/medium sized mines in the DRC, Brazil, Iran, Uzbekistan, Ecuador, Eritrea, Greece, Angola, and Morocco. As is common in this industry, disruptions in mines in key countries such as Chile, Indonesia, and Panama have raised concerns of supply shortfalls. While we do not yet see a significant gap between demand and supply, underinvestment, aging mines, and regulatory challenges will sooner or later – most likely by the end of the decade – threaten the balance of the copper market.
Based on the outlined scenario, we maintain our year-end forecasts for 2025 at USD 9,500 and 2026 at USD 9,800. On the demand side, risks are skewed to the upside; while we remain cautious about copper demand over the next fifteen months amid slow growth in the U.S. and uncertainty in China’s domestic and foreign policies, a better-than-expected performance in copper-intensive industries in either country could keep prices above USD 10,000. On the supply side, risks are likewise tilted to the upside, as continued mine disruptions could add further pressure and raise the likelihood of a significant copper deficit.
Gold: Beyond the shining rally
Gold has shown an exceptional performance year to date, exhibiting a 43% return as of mid-September. The relevant question for us becomes if this rally will last in the next 15 months, and if so, why or why not. To answer this, we consider fundamental to look at the different factors that have backed-up this behavior, which tend to be on the demand side and not much related to supply elements.
After the Russia-Ukraine war started in 2022, central bank demand emerged as a cornerstone of global gold demand. A number of central banks – most notably the People’s Bank of China – accelerated purchases to diversify reserves given the sanctions on Russia FX reserves, hedge against inflation, and reduce reliance on the U.S. dollar in the context of heightened geopolitical and financial uncertainty. Looking ahead, we expect central bank demand to continue through the rest of 2025 and into 2026, albeit at a slower pace compared to the record levels seen in 2022 and 2023. Evidence from a June survey by the World Gold Council (WGC) underscores this trend: 95% of central bank respondents believe global gold reserves will increase over the next 12 months, while a record 43% expect their own institutions to raise holdings during the same period (Figure 2). Moreover, 73% anticipate moderate to significantly lower U.S. dollar exposure in global reserves over the next five years, highlighting gold’s role as a strategic diversifier in an evolving monetary landscape.
Figure 2: Expected changes in institutional gold reserves over the next 12 months
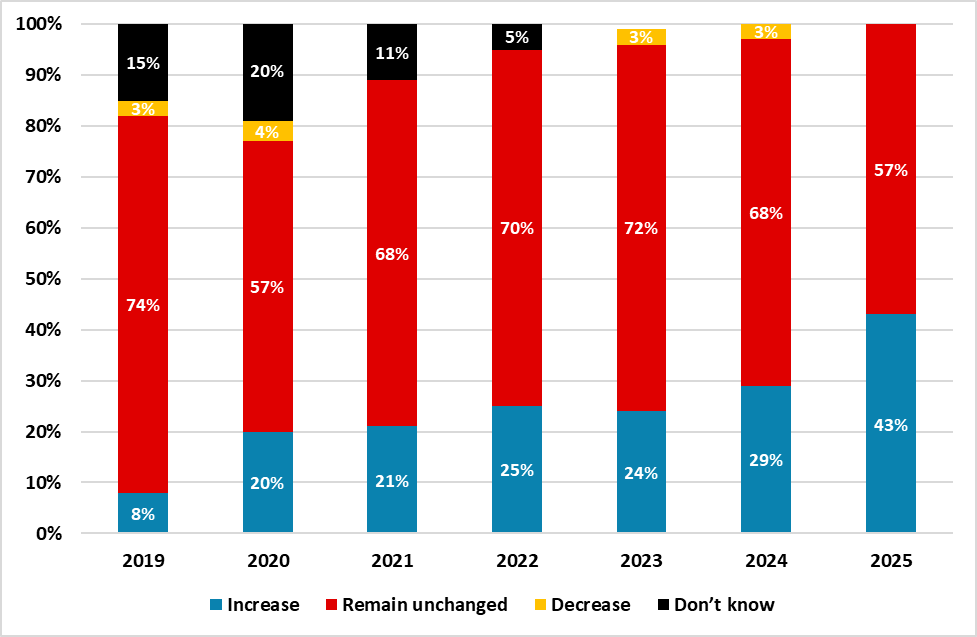
Source: World Gold Council / Continuum Economics
Note: “Don’t know” was removed as an option from the 2023 survey onwards; totals may not sum to 100% due to rounding.
An additional element to factor into the demand equation is investment in gold. In our DM rates chapter, we referenced our forecast for 10-year U.S. Treasury yields, which stands at 3.9% by end-2025 and rise to 4.3% by end-2026. In our equities chapter, we also highlighted that our baseline scenario assumes a 5-10% correction in the U.S. equity market. According to WGC data, gold-backed ETFs recorded their third consecutive month of inflows during August, led by Western funds. In 2026, we expect ETF inflows to moderate as investors reallocate toward the bond market, with gold demand potentially softening amid yields that remain elevated relative to their average over the past decade. In China, however, a weaker U.S. dollar and the possibility of an equity market correction – reflecting our concerns about weak underlying foundations – could support both gold demand and investment.
A third factor often cited as a contributor to gold demand – though we view it more as a secondary and speculative force rather than a fundamental driver – is geopolitical risk. We do not anticipate major escalations in global conflicts, including the Russia-Ukraine war, a potential Chinese invasion of Taiwan (here), or conflicts in the Middle East. We now forecast gold at USD 3,600 by end-2025 and USD 3,700 by end-2026. Risks to this outlook include weaker-than-expected demand from central banks and a correction in gold prices alongside a broader U.S. equity market downturn. Moreover, this year’s price increase has attracted rising speculative interest and these are fickle friends that could reverse on a modest or major catalyst. The scale of price gains also means that it is not clear that gold is a portfolio hedge in the scenario of a hard landing in the U.S. economy, which would likely cause a bear market in U.S. equities; major derisking and a dash to U.S. Treasuries.